A tale of collapses
Although fast bowlers held sway in the series, batting failures from Australia and New Zealand ultimately decided the result of both Tests
Madhusudhan Ramakrishnan
12-Dec-2011
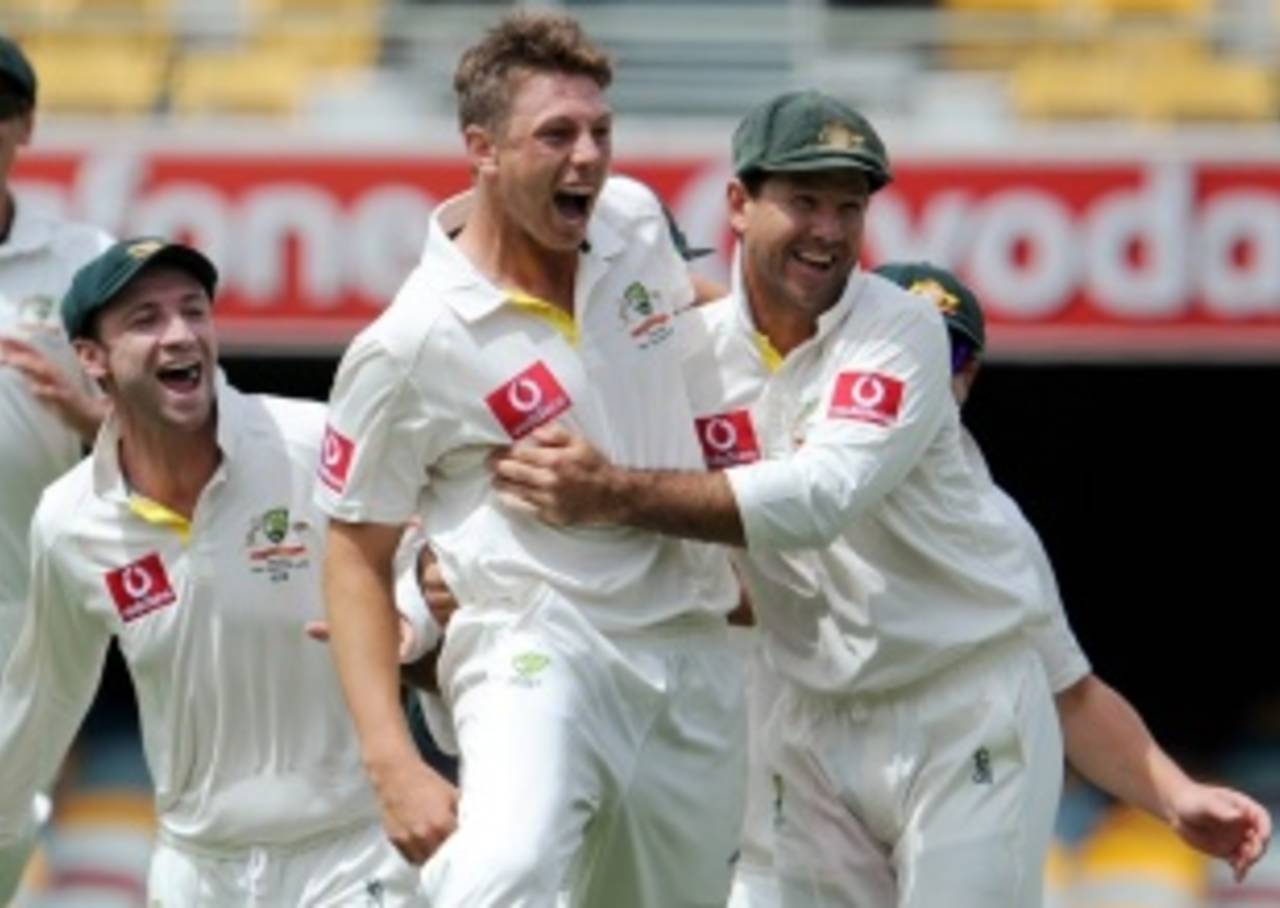
James Pattinson was the leading wicket-taker in a series dominated by fast bowlers • Getty Images
Before the series started, New Zealand nursed hopes of beating an injury-hit and inconsistent Australia. Despite losing several key players, Australia seemed right on track to seal the series after initiating a batting collapse in the New Zealand second innings in Brisbane. James Pattinson, who became the fourth Australian bowler to pick up a five-wicket haul on Test debut in 2011, followed up his performance at the Gabba with another superb spell in Hobart to bowl New Zealand out for 150. Australia, however, struggled to counter New Zealand's fast bowlers on a green pitch and fell away for just 136.
What followed was even more stunning. The hosts, after bowling themselves back into contention with a disciplined performance, abjectly collapsed from a position of strength at 159 for 2 to be bowled out for 233. What made New Zealand's achievement all the more remarkable is that it was their first Test win against Australia since 1993 and their first ever win in Australia in 26 years. On the previous occasion that New Zealand won a Test in Australia, Richard Hadlee had dominated the series picking up 33 wickets in three Tests. On this occasion, Doug Bracewell picked up 9 for 60, the fourth-best match bowling figures for a New Zealand bowler in Australia. Click here for stats highlights from the second Test.
This, however, was not the first time that Australia's batting frailties had been exposed in the last two years. They lost three times by an innings in the last Ashes series and were famously bowled out for 98 in the first innings in the Boxing Day Test in Melbourne. Australia may have fought back remarkably to square their previous series against a much stronger South African team, but the cracks in the batting line-up were exposed by South Africa's quality pace attack in both Tests. After gaining a 188-run lead in Cape Town, Australia embarrassingly crashed to 21 for 9 before a 26-run last-wicket stand lifted them to 47, their lowest total in over a century. In the second Test in Johannesburg, they once again frittered away a strong start (174 for no loss) to lose eight wickets for just 81 runs before being rescued by crucial stands for the last two wickets. Between 2004 and 2009, Australia were never bowled out for a score below 150 but since then, they have been bowled out six times.
A closer look at the partnership stats for the top six wickets for Australia in the last few years provides a clear picture. In home Tests between 2004 and 2009, they averaged 59.23 and 57.31 for the first two wickets and shared a century stand every six innings. Their corresponding averages in away Tests in the same period were 46.13 and 59.17. However, between 2010 and now, they have struggled to put up century partnerships and have much lower averages. It is not only the inability to find a solid opening pair that has plagued Australia but also the woeful form of Ricky Ponting, who was for years their finest batsman.
Ponting's lack of runs has meant that the second-wicket average has slipped badly to just 20.00 in away Tests in the last two years. Michael Hussey and Michael Clarke have been the in-form batsmen for Australia over the last one year and this is reflected in the fairly high middle-order averages. The worry for Australia, however, will be their continued inability to forge large match-changing partnerships consistently like they used to in their heyday.
| Partnership wicket | 2004-2009 (home) | 2004-2009 (away) | 2010-present (home) | 2010-present (away) |
| 1 | 59.23, 17/22, 5.64 | 46.13, 9/23, 11.22 | 33.22, 1/5, 18.00 | 46.95, 2/7, 10.50 |
| 2 | 57.31, 18/22, 5.27 | 59.17, 15/30, 6.53 | 39.18, 2/2, 9.00 | 27.75, 1/2, 20.00 |
| 3 | 49.55, 10/23, 8.80 | 48.97, 15/15, 6.20 | 20.06, 0/2, - | 47.50, 3/6, 6.66 |
| 4 | 60.87, 14/27, 5.93 | 40.16, 11/9, 8.45 | 59.18, 3/3, 5.33 | 42.20, 2/3, 10.00 |
| 5 | 47.71, 11/17, 7.36 | 36.24, 9/10, 9.77 | 25.68, 0/3, - | 45.85, 3/3, 6.66 |
| 6 | 51.65, 6/25, 12.66 | 56.31, 12/20, 6.75 | 51.33, 2/3, 7.50 | 39.47, 1/7, 20.00 |
In a series characterised by the dominance of fast bowlers on pace-friendly tracks, batsmen from both sides struggled. The only two centuries scored in the series were both made by Australia batsmen. New Zealand failed to touch 300 in any of their four innings and suffered middle-order collapses in consecutive innings in Brisbane and Hobart. Australia, who produced a strong performance in Brisbane, were found wanting in Hobart as they failed to negotiate an accurate New Zealand attack. The only century stands for both teams came for the sixth wicket and both Australia and New Zealand averaged less than 40 for each of the top five wickets. Dean Brownlie was the stand-out batsman for New Zealand scoring 196 runs at 65.33 with two half-centuries.
| Partnership wicket | Australia | New Zealand |
| 1 | 23.25, 0/1 | 25.00, 0/0 |
| 2 | 32.33, 0/1 | 5.00, 0/0 |
| 3 | 36.66, 0/1 | 18.25, 0/0 |
| 4 | 30.00, 0/1 | 28.00, 0/1 |
| 5 | 27.66, 0/1 | 12.50, 0/0 |
| 6 | 50.66, 1/0 | 51.50, 1/0 |
In the short series, fast bowlers from both sides ruled the roost as both Brisbane and Hobart presented them with plenty of assistance. With enough bounce and sideways movement to contend with, most batsmen were ill at ease against the fast bowlers and their technique was severely tested. Australia's pace attack was led by the lively Pattinson who impressed with his control and swing in his first two matches. He regularly bowled excellent lines and the New Zealand batsmen had very few answers to his ability to move the ball at pace. The Australian pace bowlers were far more successful against right-hand batsmen averaging 21.48 with a balls-per-dismissal figure of 41.32. Their corresponding numbers against left-hand batsmen were less flattering (average 36.25 and balls-per-dismissal 51.50). New Zealand, however, had better success against the Australia left-handers. Chris Martin in particular, tormented Phillip Hughes dismissing him in all four innings and ruthlessly exposed the chinks in the opener's technique outside the off stump. Nathan Lyon also benefited from the bounce and turn on offer and picked up ten wickets in the two Tests at an average of 12.60.
| Team | Batsman type | Wickets | Average | Balls per wicket |
| Australia | right-hand | 25 | 21.48 | 41.32 |
| Australia | left-hand | 4 | 36.25 | 51.50 |
| New Zealand | right-hand | 12 | 27.92 | 30.25 |
| New Zealand | left-hand | 15 | 22.53 | 39.93 |
Even before the start of this series, Hughes already had a problem with the ball leaving him outside the off stump. His woes were only compounded by Martin who regularly shaped the ball away making Hughes edge to the slip cordon. Hughes scored only 11 runs off Martin while falling four times. With David Warner scoring a century in the fourth innings, Hughes' place at the top of the order will be under threat when Shane Watson returns. The New Zealand batsmen also found the pace and movement extremely difficult to handle. Martin Guptill was troubled by Peter Siddle and was dismissed three times scoring just 22 runs. Pattinson, Australia's revelation in the series, dismissed both Ross Taylor and Brendon McCullum on three occasions conceding 37 and 31 runs respectively.
| Batsman | Bowler | No of dismissals | average | balls/dismissal |
| Phillip Hughes | Chris Martin | 4 | 2.75 | 10.25 |
| Martin Guptill | Peter Siddle | 3 | 7.33 | 17.66 |
| Ross Taylor | James Pattinson | 3 | 12.33 | 26.33 |
| Brendon McCullum | James Pattinson | 3 | 10.33 | 16.66 |
Ponting, one of only four batsmen to score over 12000 Test runs, has been going through a horrible phase in the last two years. His last Test century came in January 2010 against Pakistan and since that game, he has managed only seven fifties and averages 27.48. While it is indeed inconceivable to find a single reason why a batsman who scored 24 centuries in six years between 2002 and 2007 at an average of 70.36 is going through such a bad patch, in Ponting's case, it is worth looking at the high percentage of leg-before dismissals in recent times. Between 2002 and 2009, he was out leg before 22 times in 153 innings (about once every seven innings). This mode of dismissal represented 16.05% of his total dismissals in the period. Since June 2010, the lack of balance at the crease and his tendency to fall away towards the off stump has meant that he has been dismissed leg before nine times (eight times by pace bowlers). This is a whopping 34.61% of his total dismissals in the period. Clearly, the best approach for Ponting to arrest his decline will be to deal with the cause for the high frequency of leg-before dismissals.