Dravid in Tests: not just a "Wall" but a monument
A detailed statistical analysis of Rahul Dravid's successful Test career
This is a study of the Test career of Dravid. He has achieved a lot in the ODI arena also. However there is simply no comparison. It is Dravid's Test achievements which we need to concentrate on since it is in that arena of cricket that India is going to miss Dravid the most.
1. A summary of Dravid's career
While Dravid was at crease, a total of 62721 balls were faced by India. Dravid, thus faced, nearly half the balls received by India. While he was at crease, a total of 32468 runs were scored. As a testimony to his relatively slower scoring, he has scored just over 40% of the team runs while at crease.
2. Analysis of balls played
However the important number is the last one. Per innings, excluding none, Dravid faced an average of 109 balls. There are quite a few, Boycott, Bradman, Hammond, Hutton, Barrington, Hobbs, Sutcliffe et al who are ahead of Dravid. However no modern cricketer comes close to Dravid. The nearest is Glenn Turner of New Zealand. Dravid has faced over 25% of the completed innings team balls, in innings of 100-plus balls, 77 times, about 25% of his innings. The break-down of Dravid's innings is given below. Quite difficult to draw major inferences other than that, in about 45% of the innings, Dravid has crossed 100 balls.
200 balls and above: 48 (16.8%)
100-199 balls:       81 (28.3%)
50 to 99 balls:     60 (21.0%)
1 to 49 balls:     97 (33.8%)
3. Dravid's career graph
 Career graph of Rahul Dravid
© Anantha Narayanan
Dravid's career is expressed above in graphical form. The first innings runs are shown above mid line and the second innings scores below. The lean 11-Test period around 2008 is clear as also the revival afterwards. Look at the last four lean tests, and the wonderful Tests before these.
4. A breakdown by innings
Description T I N Runs Avge 100 50 Freq
5. A breakdown by batting position
Description T I N Runs Avge 100 50 Freq
6. Dravid's career graph: Home and Away
 Home and away performances of Rahul Dravid
© Anantha Narayanan
The above graph splits Dravid's Tests between Home and Away. Note the stronger representation of the green lines indicating away Tests. Three of the four 200s have been scored away, these four having been scored during a purple period during 2002-04. He is one of the rare batsmen who has done better away (53.03) than home (51.36). This is a tribute to his technique and ability to adopt to varying conditions. The numbers for these three graphs are available later.
7. Dravid's career graph: Results
 Dravid in wins, losses and draws
© Anantha Narayanan
The above is a graphic representation of the results. The three results are colour-coded while retaining the first and second innings separation. Note the profusion of the red lines over the last dozen Tests. However no doubting the purple patches earlier.
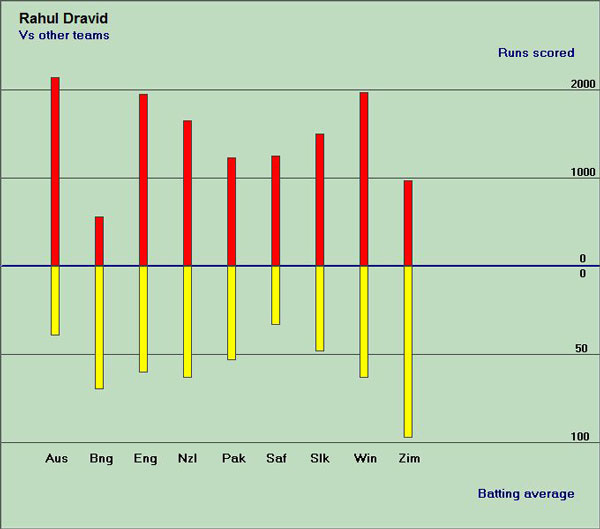
8. Dravid's career graph: Performance vs the other teams
 Dravid versus opposition teams
© Anantha Narayanan
This is a graphical representation of Dravid's performance against the other 9 teams. Certainly what stands out is the fact that Dravid had a great time against England, New Zealand, Pakistan and West Indies. However he averages below 40 against Australia and South Africa. He is slightly below par against Sri Lanka.
The tables are available below. Note Dravid's high average when the team winds and loses and how low Dravid's average is when India loses.
Description T I N Runs Avge 100 50 Freq TRuns %
9. Dravid at no.3: a special study
To have Dravid walking in at no.3, provided the adventurous openers with the license to attack, Tendulkar at no.4 to have the cushion of the impenetrable fortress ahead of him, the captain the luxury of one of the greatest batting line-ups ever, anchored around Dravid and the public, the comfort feeling that India would not go "nothing for 2" quickly. Now that we will never see Dravid walk in at no.3, it is necessary to study what Dravid faced at no.3 and what he achieved.
It has already been seen that Dravid played 219 innings at no.3, scored over 10000 runs and averaged 52.88. As top no.3 batsmen go Dravid is in the middle, with other no.3 greats like Bradman, Hammond, Richards, Sangakkara and Ponting ahead of him. That is to be expected. However that is not the point here. What positions did he come in. My first idea was to do an average of the scores. However I quickly realized that coming in at 0 for 1 and 100 for 1 was much worse than coming in at 40 for 1 and 60 for 1. So I listed the innings and derived some valuable information from that.
Dravid's no.3 summary:
10. Dravid's career analysed: by year
Description T I N Runs Avge 100 50 Freq
In terms of 10-Test streaks, the best has been between Tests 70 and 79 during 2003-04 during which Dravid scored 1301 runs at an average of 86.73. The worst has been between Tests 121 and 130 during 2008 when Dravid scored 342 runs at an average of 19.00.
11. Dravid in the opening position
Dravid has opened, much against his own preferences, a few times and has done reasonably well. Probably the most significant of his opening stints was during the disastrous tour of England in 2011, when he opened a few times and got two hundreds. The 146 he made at Oval when he carried his bat through was sublime, when no one looked like getting a fifty. His other notable opening effort was at Lahore when he and Sehwag almost crossed Roy's and Mankad's opening effort of 413. There is no denying that this was the flattest pitch ever, but India were facing a huge total.
12. Dravid's significant partnerships.
I have given below 5 significant partnerships Dravid was part of. There may be misses since this has been done mainly from memory.
1. 376 between Laxman and Dravid at Calcutta against Australia.
Almost certainly the best Indian partnership ever.
2. 303 between Dravid and Laxman at Adelaide.
Equally important one but with the roles reversed.
3. 410 between Sehwag and Dravid at Lahore. 400-plus and facing a huge total.
4. 170 between Dravid and Bangar at Headingley. The tough time in the Test.
A match-winning partnership.
5. 268 between Sehwag and Dravid at Chennai against South Africa.
Again facing a big total.
Although Dravid and Tendulkar have added 6920 runs in 140-plus partnerships,
I cannot immediately think of a great partnership. Readers could fill the gap.
13. Peer Comparisons
I have done three peer comparisons for Dravid. Two are with other international batsmen and one is with team-mates.
The first is Dravid's own batting average against the peer batting average of the 1-7 batsmen during the 704 Tests played during Dravid's career. No.7 is included since 7 is a key position in many a team and has been adorned by Gilchrist, Dhoni et al. Given below is the average comparison.
Dravid 286 13288 52.31 Peer-AT7 15452 578702 37.45 1.40
Dravid has outperformed his peer middle-order players by a huge proportion of 1.40. Just to get the perspective, Tendulkar is at 1.49, Kallis is at 1.42 and Ponting is at 1.43. Dravid's average dropped off after 2008.
The second is Dravid's own batting average against the peer batting average of the 1-7 batsmen who played for India in the 168 Tests played during Dravid's career. Given below is the average comparison.
Dravid 286 13288 52.31 Peer-IT7 1527 61323 40.16 1.30
This is as expected. With the strong Indian batting line-up, the ratio would be lower. Dravid has out-performed his team peers by 30%.
The third, and a very important one, is Dravid's no.3 position batting average against the peer batting average of the no.3 batsmen who played in the 704 Tests played during Dravid's career. Given below is the average comparison.
Dravid 219 10524 52.88 Peer-BP3 2120 87466 41.26 1.28
Dravid has outperformed his peer no.3 batsmen by a factor of 1.28. However it should be remembered that his no.3 average lags behind three batsmen, Lara, Ponting and Sangakkara.
To download/view the document containing Dravid's innings-by-innings career details, please click/right-click here.
To download/view the document containing all the tables shown above, please click/right-click here.
My favourite Dravid innings
These are my five favourite Dravid innings. I emphasize that these are my personal selections and readers may have their own.
1. 148 at Headingley. Even though India scored 600-plus, if Dravid had got out earlier, they would not have reached 250.
2. 180 at Calcutta. A little bit overshadowed by the 281, but the greatest supporting innings ever.
3. 270 at Rawalpindi won the away series in Pakistan.
4. 81 & 68 at Kingston in 2006 (when a fifty was at a premium).
5. 233 at Adelaide. Facing a 550-plus score and the score at 85 for 4, the Calcutta pair moved the world a few thousand kilometres down south, with their roles reversed.
If a writer wanted to do a tribute to Dravid, he could do that in an hour in wonderful prose. On the other hand I toil hard. Each of these graphs has taken me half a day because of data collection, formatting and colour selection. I now have a program to completely analyze a single player. But that program cannot do a cross-analysis. So if a reader feels that something new is needed, please ask. I cannot promise I would do it, but if I can, I will certainly do it.
Anantha Narayanan has written for ESPNcricinfo and CastrolCricket and worked with a number of companies on their cricket performance ratings-related systems