Post-Lord's, India's numbers weaker than in 2011
The first two Investec Tests were even, but India were swept aside in the last three so thoroughly that the overall series stats look pretty lopsided
S Rajesh
19-Aug-2014
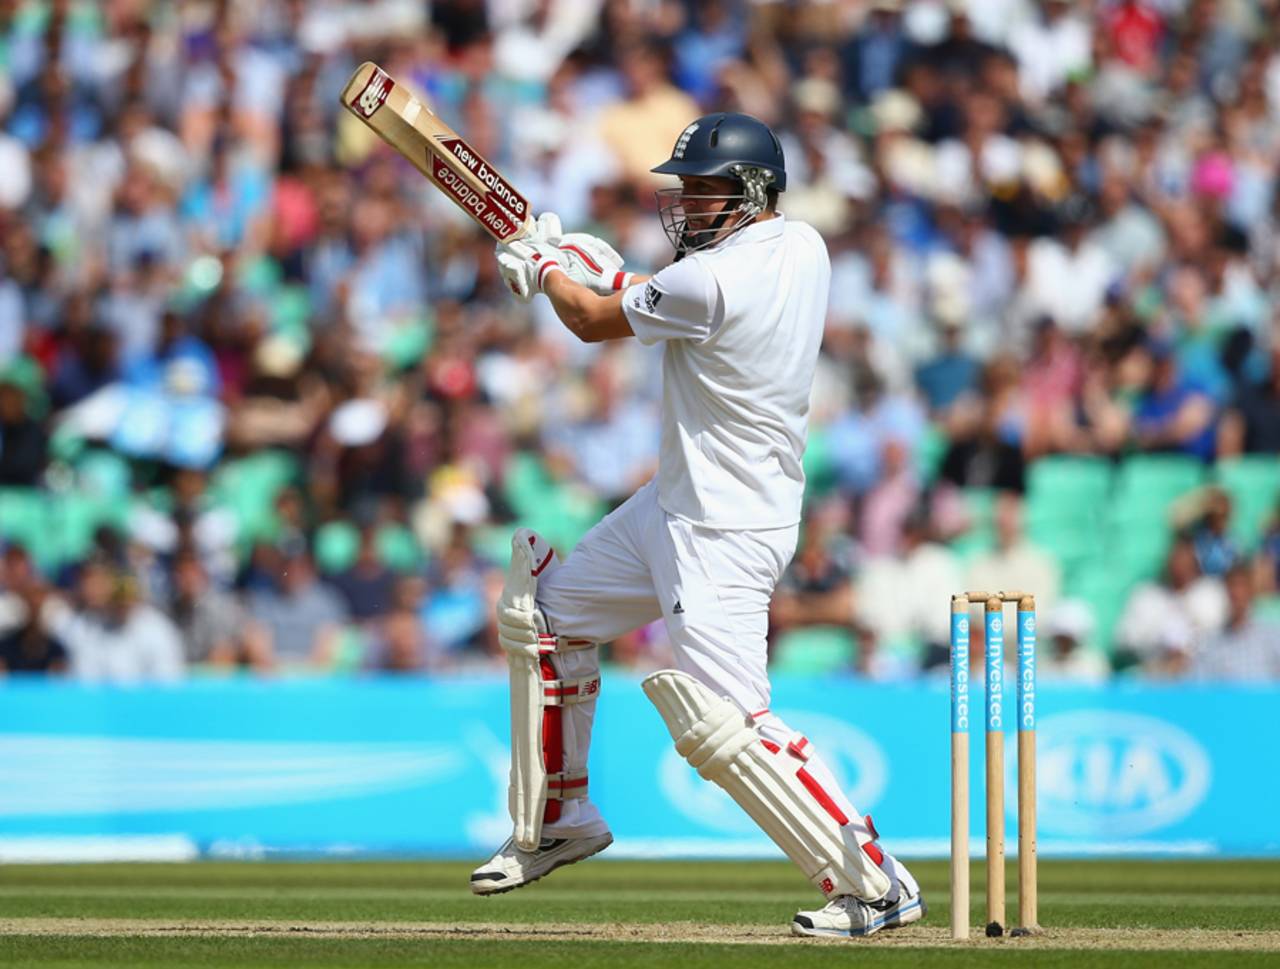
Gary Ballance scored 503 runs in the series, the first time an England No. 3 aggregated 500-plus since David Gower in the 1985 Ashes • Getty Images
This five-Test series was played in two parts. In the first, which lasted two Tests, England and India were evenly matched: neither side had much of an advantage at Trent Bride, while India took the Lord's Test by 95 runs. That was the end of the competitive part of the series, as England swept the next three matches by huge margins, with the margin in the final Test at The Oval - an innings and 244 runs - being the third-heaviest defeat ever for India.
The stats illustrate the closeness between the teams in the first two Tests, and the gulf thereafter. After Trent Bridge and Lord's, India averaged about three-and-a-half runs more per wicket with the bat, while their bowlers took wickets at a slightly better rate (one every 70.1 balls, compared to 75.6 for England). But when the home team took control, India weren't even competitive: in the last three Tests, their average dropped to a miserable 17.71 - less than a third of England's, while their bowlers took only 30 wickets (excluding run-outs), compared to 56 by England's bowlers.
Overall in the series England had 19 fifty-plus scores (five hundreds and 14 fifties) to India's 17 (two hundreds and 15 fifties). While that looks close enough, it hides the fact that England batted only once in each of the last two Tests. Overall in the series, England's batsmen played 68 innings, which means they passed 50, on average, once every 3.58 innings; India's batsmen, on the other hand, played 110 innings in the series, which means they passed 50 once every 6.47 innings. The ratio between these two numbers - which is roughly also the ratio between the batting averages - illustrates the gulf between the two teams over the series.
Compared to the numbers for the two teams in the 2011 series, the gulf in 2014 is slightly lesser, but only because of the first two Tests. In the last three, the difference was clearly more than in the four Tests in 2011.
| Team | Runs per wkt | Inngs batted | 100s/ 50s | Wkts taken* | Bowl SR** |
| England | 44.41 | 68 | 5/ 14 | 94 | 53.0 |
| India | 25.73 | 110 | 2/ 15 | 59 | 77.8 |
| Runs per wkt | Inngs batted | 100s/ 50s | Wkts taken* | Bowl SR** | |
| England - 1st and 2nd Tests | 34.60 | 33 | 2/ 5 | 38 | 75.6 |
| India - 1st and 2nd Tests | 38.07 | 44 | 2/ 10 | 29 | 70.1 |
| England - last 3 Tests | 54.23 | 35 | 3/ 9 | 56 | 37.8 |
| India - last 3 Tests | 17.71 | 66 | 0/ 5 | 30 | 85.2 |
| Team | Runs per wkt | Inngs batted | 100s/ 50s | Wkts taken* | Bowling SR** |
| England | 59.76 | 56 | 7/ 11 | 79 | 48.1 |
| India | 25.55 | 88 | 3/ 9 | 46 | 95.5 |
** Balls per wicket taken by a bowler, excluding run-outs
The batting numbers
England's dominant batting positions were clearly Nos. 3 and 5, where Gary Ballance and Joe Root pummelled India's bowlers and scored 41% of the total runs off the bat made by England. Both topped 500 runs in the series, only the 11th time two England batsmen have scored 500-plus in a series. The last time it happened was also against India, when Kevin Pietersen (533) and Ian Bell (504) made merry in the four-Test home series in 2011. Ballance became the first England No. 3 batsman to score 500-plus in a series since David Gower's aggregate of 710 in the six-Test Ashes series of 1985. Root's 518, meanwhile, is the second-highest aggregate ever for an England No. 5 in a Test series, next only to Bell's 562 in last year's home Ashes. The third-highest for an England No. 5 in a series is 492, by Stanley Jackson in 1905.
India's top order, on the other hand, struggled throughout. M Vijay was an exception over the first two Tests, but even he fell away later, scoring only 85 in his last six innings. Shikhar Dhawan and Gautam Gambhir combined to score 147 in ten innings. Virat Kohli's average of 13.40 is the third-lowest for an India top-four batsman in a Test series (with a cut-off of eight innings), while Cheteshwar Pujara's average of 22.20 is the lowest for an India No. 3 batsman in a series in England (cut-off of five innings). Ajinkya Rahane shone at Lord's and Southampton, but scored only 29 in his last four innings.
| England | India | |||||
| Position | Runs | Average | 100s/ 50s | Runs | Average | 100s/ 50s |
| Openers | 463 | 35.61 | 0/ 4 | 549 | 27.45 | 1/ 2 |
| No. 3 | 503 | 71.85 | 2/ 2 | 222 | 22.20 | 0/ 1 |
| No. 4 | 297 | 42.42 | 1/ 1 | 134 | 13.40 | 0/ 0 |
| No. 5 | 454 | 90.80 | 2/ 2 | 299 | 33.22 | 1/ 2 |
| No. 6 | 188 | 31.33 | 0/ 1 | 327 | 32.70 | 0/ 3 |
| No. 7 | 215 | 43.00 | 0/ 2 | 149 | 16.55 | 0/ 1 |
| No. 8 | 100 | 20.00 | 0/ 1 | 308 | 34.22 | 0/ 2 |
| No. 9 | 101 | 25.25 | 0/ 0 | 247 | 27.44 | 0/ 3 |
| No. 10 | 67 | 22.33 | 0/ 0 | 50 | 5.55 | 0/ 0 |
| No. 11 | 112 | 22.40 | 0/ 1 | 86 | 21.50 | 0/ 1 |
The partnership numbers
England had eight century stands in the series, including three for the second wicket alone. Ballance was involved in four of the eight century stands, and Root in three, including the series-topping stand of 198 with James Anderson at Trent Bridge. India had just two century partnerships in the entire series, one of which was for the tenth wicket.
Overall in the series, England had 61 partnerships, of which there were eight century stands - an average of a hundred stand every 7.6 innings; India had two century stands out of 100 partnerships, an average of one every 50 innings. Balance and Cook were the leading pair of the series, with 414 partnership runs in five innings, while India's best combination was Vijay and Pujara, with 325 runs in seven partnerships.
The bowling numbers
Again, in the first two Tests there was little to choose between the seam bowlers of the two teams, but in the last three England's pace attack - led by Anderson and Stuart Broad - averaged 18.83 runs per wicket, compared to India's 58.20. Moeen Ali was ordinary with the bat, but his spin was far more effective than Ravindra Jadeja and R Ashwin's.
Anderson's 25 wickets was his best haul for a series, while it's the second successive time an England fast bowler has taken 25 wickets in a home series against India: in 2011 Broad took 25 at an average of 13.84. In the last two home series against India, Anderson and Broad have remarkably similar combined stats: Anderson has 46 wickets in nine Tests at 22.93, while Broad has 44 wickets at 17.79.
| England | India | |||||
| Wickets | Average | Strike rate | Wickets | Average | Strike rate | |
| Pace - 1st 2 Tests | 30 | 36.76 | 78.3 | 25 | 30.84 | 58.0 |
| Spin - 1st 2 Tests | 7 | 42.28 | 72.8 | 4 | 53.00 | 145.7 |
| Pace - last 3 Tests | 43 | 18.83 | 41.4 | 20 | 58.20 | 91.2 |
| Spin - last 3 Tests | 13 | 13.76 | 25.6 | 10 | 40.50 | 73.4 |
The head-to-head battles
The story of the series was the manner in which Anderson and Broad dominated India's batsmen, and that's reflected in the numbers below. All the Indian top-order batsmen struggled against at least one of these two bowlers. The Anderson-Kohli battle - a highly one-sided one - was prominently talked about throughout the series, and the numbers illustrate Anderson's dominance: he averaged 4.75 runs per wicket against Kohli, and dismissed him four times. Anderson needed to work much harder to dismiss Vijay, but towards the end of the series, especially, he dominated Vijay too, setting him up superbly with a combination of outswingers and inswingers. Either Anderson or Broad dismissed each of India's top-six batsmen at least three times in the series: Anderson took care of Kohli, Vijay and Dhawan, while Broad handled Pujara, Rahane and Dhoni.
The control factor, which measures the percentage of deliveries a batsman middled or left alone against each bowler, presents some interesting numbers too. Dhawan was dismissed three times by Anderson and never by Broad in the series, but against Broad Dhawan achieved a control factor of only 69.2%, compared to 87.2 against Anderson. That indicates Dhawan was generally more uncomfortable against Broad, even though Anderson dismissed him more often.
Overall too, Anderson and Broad were extremely effective against India's top-order batsmen. Nineteen of Anderson's 25 wickets were of India's top seven batsmen (including MS Dhoni), and he averaged 19.52 against them; Broad averaged slightly more but he caused more problems for the batsmen, who achieved a control percentage of only 77.5 against him, compared to 82.4 against Anderson.
| Bowler | Batsman | Runs | Balls | Dismissals | Average | Runs/ over | Control % |
| James Anderson | Virat Kohli | 19 | 50 | 4 | 4.75 | 2.28 | 78.0 |
| James Anderson | Murali Vijay | 106 | 337 | 4 | 26.50 | 1.88 | 83.6 |
| James Anderson | Shikhar Dhawan | 32 | 78 | 3 | 10.66 | 2.46 | 87.2 |
| Stuart Broad | MS Dhoni | 49 | 132 | 3 | 16.33 | 2.22 | 71.2 |
| Stuart Broad | Cheteshwar Pujara | 20 | 69 | 3 | 6.66 | 1.73 | 71.0 |
| Stuart Broad | Ajinkya Rahane | 41 | 139 | 3 | 13.66 | 1.76 | 81.3 |
| James Anderson | MS Dhoni | 96 | 187 | 2 | 48.00 | 3.08 | 74.9 |
| Stuart Broad | Murali Vijay | 88 | 266 | 1 | 88.00 | 1.98 | 85.3 |
| James Anderson | Ajinkya Rahane | 61 | 125 | 1 | 61.00 | 2.92 | 84.8 |
| Stuart Broad | Shikhar Dhawan | 51 | 65 | 0 | - | 4.70 | 69.2 |
| Bowler | Runs | Balls | Dismissals | Average | Runs/ over | Control % |
| James Anderson | 371 | 953 | 19 | 19.52 | 2.33 | 82.4 |
| Stuart Broad | 286 | 785 | 13 | 22.00 | 2.18 | 77.5 |
| Moeen Ali | 257 | 412 | 9 | 28.55 | 3.74 | 86.4 |
In the head-to-heads between England batsmen and Indian bowlers, there were a few battles where the Indians came out on top, but in most of them the batsmen dominated. Bhuvneshwar Kumar had good stats against Ian Bell and Sam Robson, while Ishant Sharma dominated Bell too, but most of the other averages were overwhelmingly in favour of the batsmen. Root averaged more than 100 against Ishant, and 83 against Bhuvneshwar; Ballance averaged 105 against Bhuvneshwar, and 61 against Ishant.
However, the control numbers are interesting again. Against Bhuvneshwar, the control numbers were pretty high for England's batsmen, but against Ishant they dipped to the early 70s. He did finish with 14 wickets at 27.21 in the series, but with some luck Ishant could have finished with even more impressive numbers in the series.
| Bowler | Batsman | Runs | Balls | Dismissals | Average | Runs/ over | Control % |
| Bhuvneshwar Kumar | Ian Bell | 46 | 106 | 3 | 15.33 | 2.60 | 85.8 |
| Ishant Sharma | Ian Bell | 19 | 40 | 3 | 6.33 | 2.85 | 70.0 |
| Bhuvneshwar Kumar | Sam Robson | 60 | 168 | 3 | 20.00 | 2.14 | 83.9 |
| Varun Aaron | Alastair Cook | 29 | 54 | 2 | 14.50 | 3.22 | 70.4 |
| Ishant Sharma | Joe Root | 112 | 167 | 1 | 112.00 | 4.02 | 70.6 |
| Bhuvneshwar Kumar | Gary Ballance | 105 | 198 | 1 | 105.00 | 3.18 | 86.9 |
| Bhuvneshwar Kumar | Joe Root | 83 | 143 | 1 | 83.00 | 3.48 | 88.8 |
| Bhuvneshwar Kumar | Alastair Cook | 67 | 156 | 1 | 67.00 | 2.57 | 89.7 |
| Varun Aaron | Joe Root | 65 | 108 | 0 | - | 3.61 | 84.2 |
| Ishant Sharma | Gary Ballance | 61 | 126 | 1 | 61.00 | 2.90 | 78.6 |
S Rajesh is stats editor of ESPNcricinfo. @rajeshstats