More runs, sixes, and close finishes
In a tournament of several stats highlights, the team with the best numbers deservedly lifted the cup
S Rajesh
29-May-2012
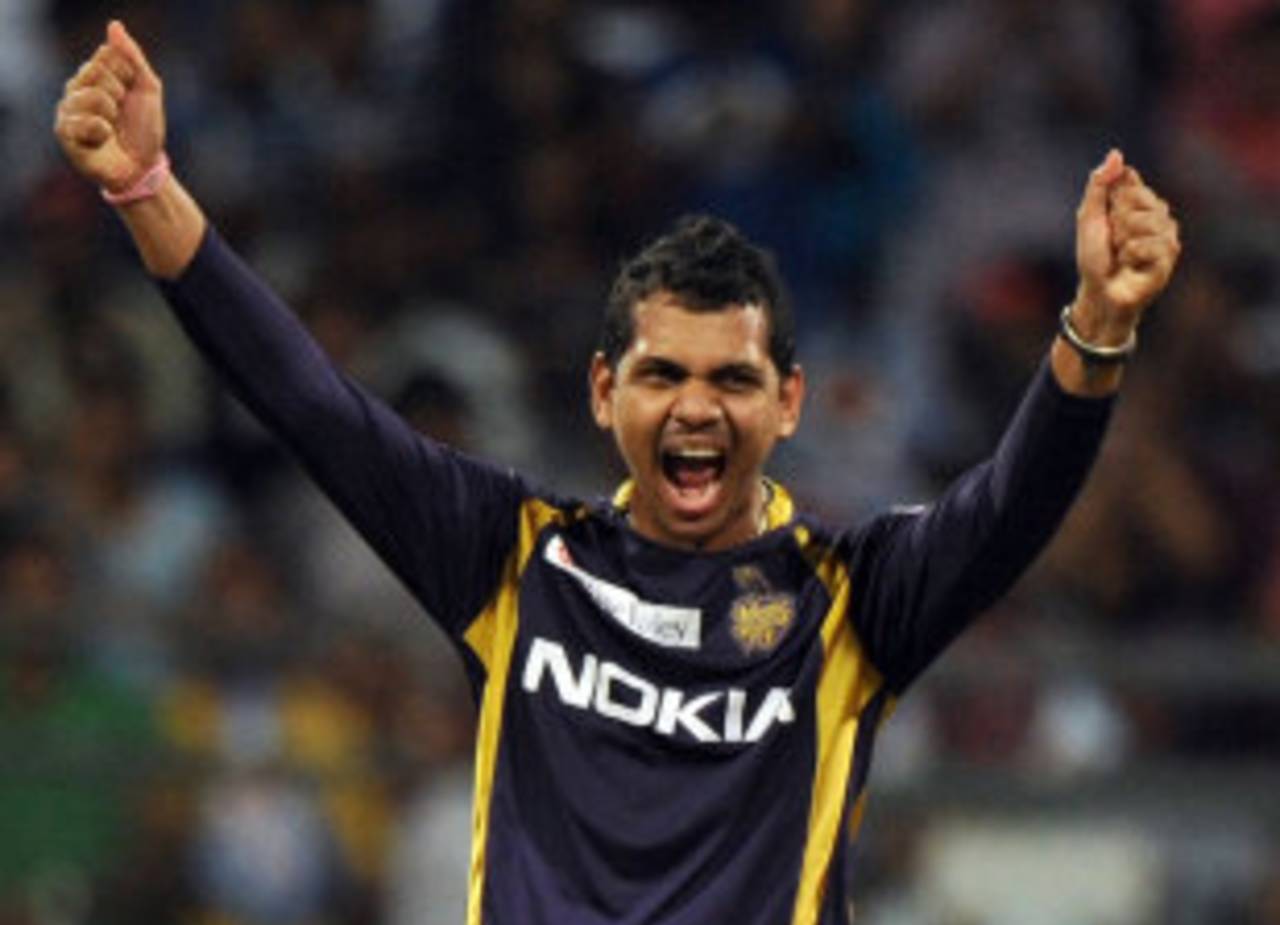
It wasn't a great IPL for spinners, but Sunil Narine's efforts stood out • AFP
In the end, the best team won IPL 2012. It doesn't always happen that way in such a long tournament which has knockout matches at the end, but in this case Kolkata Knight Riders were the deserving winners despite some stunning performances from Chennai Super Kings in the last week. Knight Riders weren't the best batting side - three teams scored more runs than they did in the tournament, five teams had better run-rates, and they were also one of four sides to finish without a centurion. However, as a bowling unit, they were clearly the best: they finished as the joint-highest wicket-takers with 107, while their bowling average and economy rate was better than any other side in the tournament. Out of 102 fifty-plus scores in the tournament, only seven were scored against Knight Riders, which indicates how tough it was to score against them. (There were 15 such scores against Super Kings, and 13 against Delhi Daredevils.)
As the table below shows, the difference between the batting and bowling averages, and the run-rates with bat and ball, were both the highest for Knight Riders, who also had by far the best win-loss ratio of 2.40 - Daredevils were next at 1.57. Super Kings, on the other hand, were fourth in terms of win-loss ratio, at 1.25. While all other teams lost at least seven matches in the tournament, Knight Riders lost only five. The only team to have lost fewer matches in an entire IPL campaign is Rajasthan Royals - they lost only three in their title-winning effort in 2008.
Daredevils finished on top of the table after the round-robin matches, but let themselves down with two poor games in the knockouts, which pulled down their overall numbers considerably: their batting averages and strike rates were only slightly higher than their corresponding bowling ones.
| Teams | W/L | Runs scored | Ave/ RR | Wkts taken | Ave/ ER | Ave diff | RR diff |
| Kolkata Knight Riders | 12/ 5 | 2504 | 26.63/ 7.70 | 107 | 22.11/ 7.16 | 4.52 | 0.54 |
| Chennai Super Kings | 10/ 8 | 2831 | 28.02/ 8.01 | 107 | 24.49/ 7.72 | 3.53 | 0.29 |
| Delhi Daredevils | 11/ 7 | 2645 | 28.13/ 8.24 | 101 | 27.17/ 7.94 | 0.96 | 0.30 |
| Mumbai Indians | 10/ 7 | 2462 | 23.22/ 7.43 | 106 | 23.86/ 7.65 | -0.64 | -0.22 |
Knight Riders' bowling firepower
Though it was the batting that really turned it on in the final, soaking up the pressure and chasing an above-par score, Knight Riders' bowling was their stronger suit, and it stayed consistent through all stages of the 20 overs that they spent on the field. In the Powerplay overs Jacques Kallis was among the best for them, bowling 19 overs and taking 7 for 114. Sunil Narine was obviously outstanding, with figures of 3 for 74 in 16 overs, while L Balaji, who missed out on the final, had 3 for 51 from 10 overs. The disappointment was Brett Lee: he went for 169 runs in 22 overs, and took just two wickets. Overall in the Powerplay overs, only one team - Mumbai Indians - had a better economy rate than Knight Riders.
Though it was the batting that really turned it on in the final, soaking up the pressure and chasing an above-par score, Knight Riders' bowling was their stronger suit, and it stayed consistent through all stages of the 20 overs that they spent on the field. In the Powerplay overs Jacques Kallis was among the best for them, bowling 19 overs and taking 7 for 114. Sunil Narine was obviously outstanding, with figures of 3 for 74 in 16 overs, while L Balaji, who missed out on the final, had 3 for 51 from 10 overs. The disappointment was Brett Lee: he went for 169 runs in 22 overs, and took just two wickets. Overall in the Powerplay overs, only one team - Mumbai Indians - had a better economy rate than Knight Riders.
In the middle and final overs, though, Knight Riders were easily the best bowling side, taking wickets and maintaining an excellent economy rate. In the middle overs (6.1 to 15), they had a couple of unlikely heroes. Rajat Bhatia took nine wickets at an economy rate of 7.17, while Balaji was terrific again, taking 6 for 81 in 14 overs, an economy rate of 5.78. In the slog overs Narine was their go-to bowler, and he rarely let them down, taking 21 wickets for 185 runs in 157 balls - an economy rate of 7.07 and an average of 8.80. Those were the best slog-over bowling stats of the tournament, marginally better than Lasith Malinga's 18 wickets at 10.27 and an economy rate of 7.55.(Click here for the batting and bowling stats for Knight Riders, and here for the overall IPL 2012 stats.)
| Team | Powerplay - wkts | Ave/ ER | 6.1-15 - wkts | Ave/ ER | 15.1-20 - wkts | Ave/ ER |
| Kolkata Knght Riders | 22 | 31.90/ 6.69 | 37 | 27.29/ 6.77 | 48 | 13.62/ 8.26 |
| Chennai Super Kings | 21 | 39.57/ 7.33 | 41 | 28.80/ 7.36 | 45 | 13.53/ 8.57 |
| Delhi Daredevils | 27 | 28.81/ 6.98 | 39 | 31.41/ 7.70 | 35 | 21.20/ 9.47 |
| Mumbai Indians | 24 | 28.12/ 6.38 | 37 | 30.45/ 7.37 | 45 | 16.17/ 9.62 |
| Royal Challengers Bangalore | 17 | 39.64/ 7.24 | 35 | 29.82/ 7.73 | 37 | 21.27/ 10.56 |
| Kings XI Punjab | 23 | 29.47/ 6.83 | 33 | 32.72/ 7.50 | 37 | 18.83/ 9.65 |
| Rajasthan Royals | 23 | 30.30/ 6.92 | 37 | 27.59/ 7.09 | 32 | 21.37/ 9.86 |
| Deccan Chargers | 21 | 32.19/ 7.26 | 34 | 29.85/ 7.51 | 28 | 25.50/ 10.73 |
| Pune Warriors | 18 | 38.94/ 7.08 | 29 | 37.37/ 7.52 | 32 | 19.96/ 9.12 |
Close finishes
One of the highlights of IPL season 5 was the number of games that were decided in the last over. There were seven games in which the team chasing won off the last ball - Super Kings achieved it three times, and Mumbai Indians twice. Twelve more matches were won in the last over by the team batting second, while in six more games, the team batting first won by less than ten runs. Thus, in the 74 games in which there were results - two were washed out - there were 25 where either the team batting first won by less than ten runs, or the team chasing won in the last over. As a percentage of total matches, that's only bettered by the 2009 edition in South Africa, when 20 out of 56 matches had these results.
One of the highlights of IPL season 5 was the number of games that were decided in the last over. There were seven games in which the team chasing won off the last ball - Super Kings achieved it three times, and Mumbai Indians twice. Twelve more matches were won in the last over by the team batting second, while in six more games, the team batting first won by less than ten runs. Thus, in the 74 games in which there were results - two were washed out - there were 25 where either the team batting first won by less than ten runs, or the team chasing won in the last over. As a percentage of total matches, that's only bettered by the 2009 edition in South Africa, when 20 out of 56 matches had these results.
However, compared to the last two years, many more games have produced close results. In 2011, there were only two instances when the team chasing won off the last ball, while in 2010 there were no such results.
| Year | Matches | <10 runs* | Last over# | Percentage |
| 2012 | 74 | 6 | 19 | 33.78 |
| 2011 | 72 | 4 | 11 | 20.83 |
| 2010 | 59 | 3 | 11 | 23.73 |
| 2009 | 56 | 7 | 13 | 35.71 |
| 2008 | 58 | 7 | 11 | 31.03 |
# Team batting second won in last over
More matches, more runs, more sixes
Overall, IPL 2012 had more of pretty much everything - matches, runs, wickets, sixes and fifty-plus scores. (They had more than their share of controversies too, but that's beyond the scope of this piece.) There were two fewer fours struck this year than in 2011, but that was more than compensated by the number of sixes - 731 this year, compared to 639 in 2011. There were six centuries too, which equalled the mark set in two previous seasons.
Overall, IPL 2012 had more of pretty much everything - matches, runs, wickets, sixes and fifty-plus scores. (They had more than their share of controversies too, but that's beyond the scope of this piece.) There were two fewer fours struck this year than in 2011, but that was more than compensated by the number of sixes - 731 this year, compared to 639 in 2011. There were six centuries too, which equalled the mark set in two previous seasons.
In terms of overall averages and run-rates, though, IPL 2012 was very similar to its previous edition: the average and run-rate was only very marginally higher. The run-rate, though, was lower than that in 2008 and 2010.
| Year | Matches | Runs | Wkts | Average | RPO | 100s/ 50s | 4s/ 6s |
| 2012 | 75 | 22,453 | 857 | 26.19 | 7.82 | 6/ 96 | 1911/ 731 |
| 2011 | 73 | 21,154 | 813 | 26.01 | 7.72 | 6/ 89 | 1913/ 639 |
| 2010 | 60 | 18,864 | 720 | 26.20 | 8.12 | 4/ 88 | 1709/ 585 |
| 2009 | 57 | 16,320 | 697 | 23.41 | 7.48 | 2/ 68 | 1316/ 506 |
| 2008 | 58 | 17,937 | 689 | 26.03 | 8.30 | 6/ 83 | 1702/ 622 |
Pace v spin
Despite the outstanding performance of Narine and Muttiah Muralitharan, spinners overall didn't have such a great time - among the top eight wicket-takers, there was only one spinner. In fact, the average for spinners slipped past 30 for the first time since the opening IPL season, and 31.35 is the highest that spinners have collectively averaged in an IPL season.
Despite the outstanding performance of Narine and Muttiah Muralitharan, spinners overall didn't have such a great time - among the top eight wicket-takers, there was only one spinner. In fact, the average for spinners slipped past 30 for the first time since the opening IPL season, and 31.35 is the highest that spinners have collectively averaged in an IPL season.
Like in the 2011 edition, spinners bowled a fair bit during the Powerplay, but didn't get the rewards they had last year. In 2011, they had bowled 23% of the total deliveries bowled in the Powerplay overs, and taken 24% of the wickets (average 27.02, economy rate 6.62). This time, they bowled 24% of the deliveries, but got only 17% of the wickets (average 46.22, economy rate 6.79). They were still more economical than the faster bowlers, who went at 7.13 in the Powerplay overs, but they lacked the ability to take wickets.
| Season | Pace-wkts | Ave/ ER | Spin-wkts | Ave/ ER |
| 2012 | 531 | 27.19/ 7.81 | 241 | 31.35/ 7.41 |
| 2011 | 470 | 28.12/ 7.80 | 268 | 27.60/ 7.11 |
| 2010 | 405 | 29.64/ 8.32 | 210 | 28.80/ 7.34 |
| 2009 | 388 | 26.25/ 7.65 | 226 | 24.77/ 6.77 |
| 2008 | 445 | 29.23/ 8.09 | 134 | 30.38/ 8.18 |
S Rajesh is stats editor of ESPNcricinfo. Follow him on Twitter