Gayle and Malinga take top honours
Brendon McCullum's unbeaten 158 in the IPL opener in 2008 continues to be the best batting performance, while Anil Kumble's 5 for 5 is the top bowling display
S Rajesh
02-Apr-2013
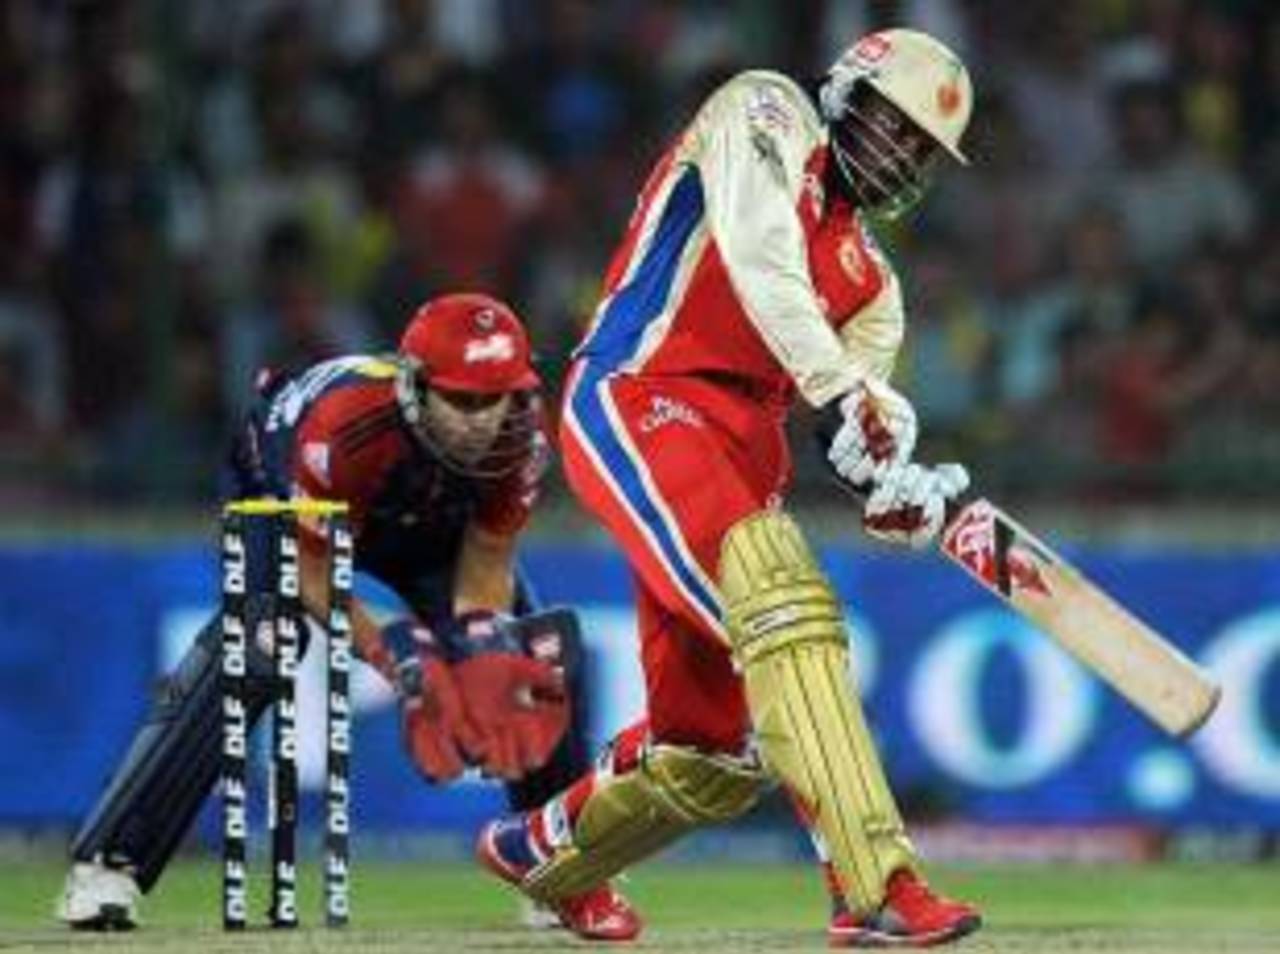
Chris Gayle is the clear leader among IPL batsmen, and is the only one to score three hundreds • AFP
The IPL is now five seasons old, over which period 4931 innings have been played in 323 matches, but the best batting performance in these five seasons remains the one that was played by an opener in the first innings of the very first match of the competition. Brendon McCullum's unbeaten 158 off 73 balls for Kolkata Knight Riders, when he creamed 13 sixes off the hapless Royal Challengers Bangalore attack, remains at the top of the pile of best innings with 81.10 points, well clear of Sanath Jayasuriya's 114 off 48 in the same season for Mumbai Indians against Chennai Super Kings.
The top three innings are all hundreds, but the fourth one is a bit of a surprise: Harbhajan Singh's unbeaten 49 off 18 is fourth, but one look at the match scorecard and the context of his runs explains his high position: Harbhajan came in to bat at 119 for 7 in the 17th over, and blasted 49 to lift his team to 172; in reply, Deccan Chargers were bowled out for 131.
Virender Sehwag is the only player to feature three times in the top 15 - in third, eighth and 15th spots. Adam Gilchrist takes the fifth and sixth spots for innings of 85 (off 35) and 109 (off 47). Both these knocks were in identical chases, but the century came in an easier chase, when Gilchrist and VVS Laxman combined in an unbeaten first-wicket partnership of 155 against Mumbai Indians; his 85 came in a chase of 154, against Delhi Daredevils, but this time Chargers lost four wickets, and the second-highest score was only 24. Yusuf Pathan and Chris Gayle are the others to feature more than once.
| Batsman | Innings | Strike rate | For | Against | Season | Points |
| Brendon McCullum | 158 off 73 | 216.44 | KKR | RCB | 2008 | 81.10 |
| Sanath Jayasuriya | 114 off 48 | 237.50 | MI | CSK | 2008 | 72.41 |
| Virender Sehwag | 119 off 56 | 212.50 | DD | DC | 2011 | 66.29 |
| Harbhajan Singh | 49 off 18 | 272.22 | MI | DC | 2010 | 65.47 |
| Adam Gilchrist | 85 off 35 | 242.86 | DC | DD | 2009 | 65.38 |
| Adam Gilchrist | 109 off 47 | 231.91 | DC | MI | 2008 | 65.23 |
| Yusuf Pathan | 100 off 37 | 270.27 | RR | MI | 2010 | 64.55 |
| Virender Sehwag | 94 off 41 | 229.27 | DD | DC | 2008 | 64.47 |
| Chris Gayle | 128 off 62 | 206.45 | RCB | DD | 2012 | 63.07 |
| Suresh Raina | 98 off 55 | 178.18 | CSK | RR | 2009 | 62.73 |
| Yusuf Pathan | 62 off 30 | 206.67 | RR | DD | 2009 | 62.50 |
| MS Dhoni | 70 off 40 | 175.00 | CSK | RCB | 2011 | 62.08 |
| Chris Gayle | 107 off 49 | 218.37 | RCB | KXI | 2011 | 60.95 |
| Rohit Sharma | 109 off 60 | 181.67 | MI | KKR | 2012 | 60.49 |
| Virender Sehwag | 75 off 34 | 220.59 | DD | RR | 2010 | 60.00 |
The two best batting performances are from the 2008 season, and the two best bowling ones are from 2009. Anil Kumble leads the way, for his 5 for 5 against Rajasthan Royals in Cape Town in 2009. Amit Singh comes in in second place for his spell of 3 for 9 in a relatively high-scoring match against Kings XI Punjab in which 344 runs were scored in 40 overs. That's followed by Sohail Tanvir's 6 for 14 against Chennai Super Kings.
Because of a significant amount of weightage being given to the economy rates, some of the best performances in the table below are those in which bowlers have taken two or three wickets, but at very good economy rates. Rahul Sharma's 2 for 7 off four overs, for instance, came in a match against Mumbai Indians in which 299 runs were scored in 40 overs, and no other bowler went at less than five runs per over. Similarly, Lasith Malinga (3 for 9 versus Deccan Chargers) and Dale Steyn (3 for 8 against Royal Challengers make it to the top ten because of their economy rates as well.
| Bowler | Spell | Econ rate | For | Against | Season | Points |
| Anil Kumble | 5 for 5 | 1.57 | RCB | RR | 2009 | 71.80 |
| Amit Singh | 3 for 9 | 2.25 | RR | KXIP | 2009 | 70.54 |
| Sohail Tanvir | 6 for 14 | 3.50 | RR | CSK | 2008 | 70.15 |
| Rahul Sharma | 2 for 7 | 1.75 | PW | MI | 2011 | 67.99 |
| Amit Mishra | 4 for 9 | 2.25 | DC | KXIP | 2011 | 67.86 |
| Ajit Chandila | 4 for 13 | 3.25 | RR | PW | 2012 | 66.96 |
| Lasith Malinga | 3 for 9 | 2.25 | MI | DC | 2011 | 66.02 |
| Ishant Sharma | 5 for 12 | 4.00 | DC | KTK | 2011 | 64.79 |
| Dale Steyn | 3 for 8 | 2.00 | DC | RCB | 2012 | 63.56 |
| Amit Mishra | 5 for 17 | 4.25 | DD | DC | 2008 | 63.33 |
| Munaf Patel | 5 for 21 | 5.25 | MI | KXIP | 2011 | 63.20 |
| Sohail Tanvir | 3 for 10 | 2.50 | RR | RCB | 2008 | 62.44 |
| Ravindra Jadeja | 5 for 16 | 4.00 | CSK | DC | 2012 | 62.09 |
| Harbhajan Singh | 4 for 17 | 4.25 | MI | DD | 2009 | 61.85 |
| Shoaib Akhtar | 4 for 11 | 3.66 | KKR | DD | 2008 | 61.30 |
In terms of overall numbers, there's no doubt regarding the best batsman in all IPL seasons put together. Six batsmen have scored more runs than Gayle, but none as been as consistently destructive as Gayle: over 42 innings, he averages 50.11 at a strike rate of almost 162. He is also the only batsman to score three hundreds, and was Player of the Tournament in 2011. Gayle's 12 Man-of-the-Match awards are the joint-highest in all IPL matches - he shares the record with Yusuf Pathan.
Averaging out the rating points for all batsmen, Gayle's average score of 24.30 is about 20% better than the next-best, Shaun Marsh's 20.11. Marsh is one of three Australians who occupy the slots immediately after the top position, while Indian batsmen dominate the rest of the top ten, with five of them in the next six. Sehwag is marginally ahead of Sachin Tendulkar, while Suresh Raina and MS Dhoni round off the top ten.
| Batsman | Matches | Runs | Average | Strike rate | Points |
| Chris Gayle | 43 | 1804 | 50.11 | 161.79 | 24.30 |
| Shaun Marsh | 42 | 1603 | 45.80 | 135.96 | 20.11 |
| Shane Watson | 39 | 1242 | 40.06 | 146.80 | 18.75 |
| Matthew Hayden | 32 | 1107 | 36.90 | 137.51 | 18.55 |
| Virender Sehwag | 66 | 1879 | 30.30 | 167.31 | 16.24 |
| Sachin Tendulkar | 64 | 2047 | 37.90 | 119.21 | 15.90 |
| Michael Hussey | 29 | 958 | 39.91 | 120.65 | 15.86 |
| Gautam Gambhir | 72 | 2065 | 33.30 | 128.90 | 15.52 |
| Suresh Raina | 81 | 2254 | 33.64 | 139.39 | 15.41 |
| MS Dhoni | 78 | 1782 | 37.12 | 136.44 | 14.82 |
Not only is Malinga the leading wicket-taker in IPL, he also has the best average points (calculated by averaging out his points for every IPL bowling performance). Malinga is a couple of points clear of Muttiah Muralitharan, who is in second place. The rest of the top ten is bunched together very closely, with less than three points separating the second-ranked Muralitharan from the tenth-ranked Ashish Nehra.
| Bowler | Matches | Wickets | Average | Economy rate | Points |
| Lasith Malinga | 56 | 83 | 16.63 | 6.36 | 25.44 |
| Muttiah Muralitharan | 55 | 57 | 24.47 | 6.48 | 23.50 |
| Dale Steyn | 52 | 59 | 22.10 | 6.58 | 23.49 |
| Amit Mishra | 59 | 74 | 20.67 | 7.10 | 23.08 |
| Anil Kumble | 42 | 45 | 23.51 | 6.57 | 22.97 |
| Morne Morkel | 31 | 38 | 23.26 | 7.36 | 22.23 |
| R Ashwin | 49 | 49 | 22.95 | 6.22 | 22.05 |
| Munaf Patel | 57 | 70 | 21.48 | 7.37 | 21.51 |
| Ryan Harris | 34 | 44 | 22.15 | 7.69 | 21.45 |
| Ashish Nehra | 44 | 48 | 24.83 | 7.55 | 20.93 |
Salient points about the performance analysis methodology
- Each batting and bowling performance by every player in the IPL gets a score, based on the runs scored and the strike rate, or the wickets taken and the economy rate.
S Rajesh is stats editor of ESPNcricinfo. Follow him on Twitter