Kings XI's middle-overs strength, and the Narine factor
Kings XI Punjab and Kolkata Knight Riders have met three times this season, but the IPL is yet to witness a genuinely explosive meeting between its two best sides. That might well change in Sunday's final
S Rajesh
31-May-2014
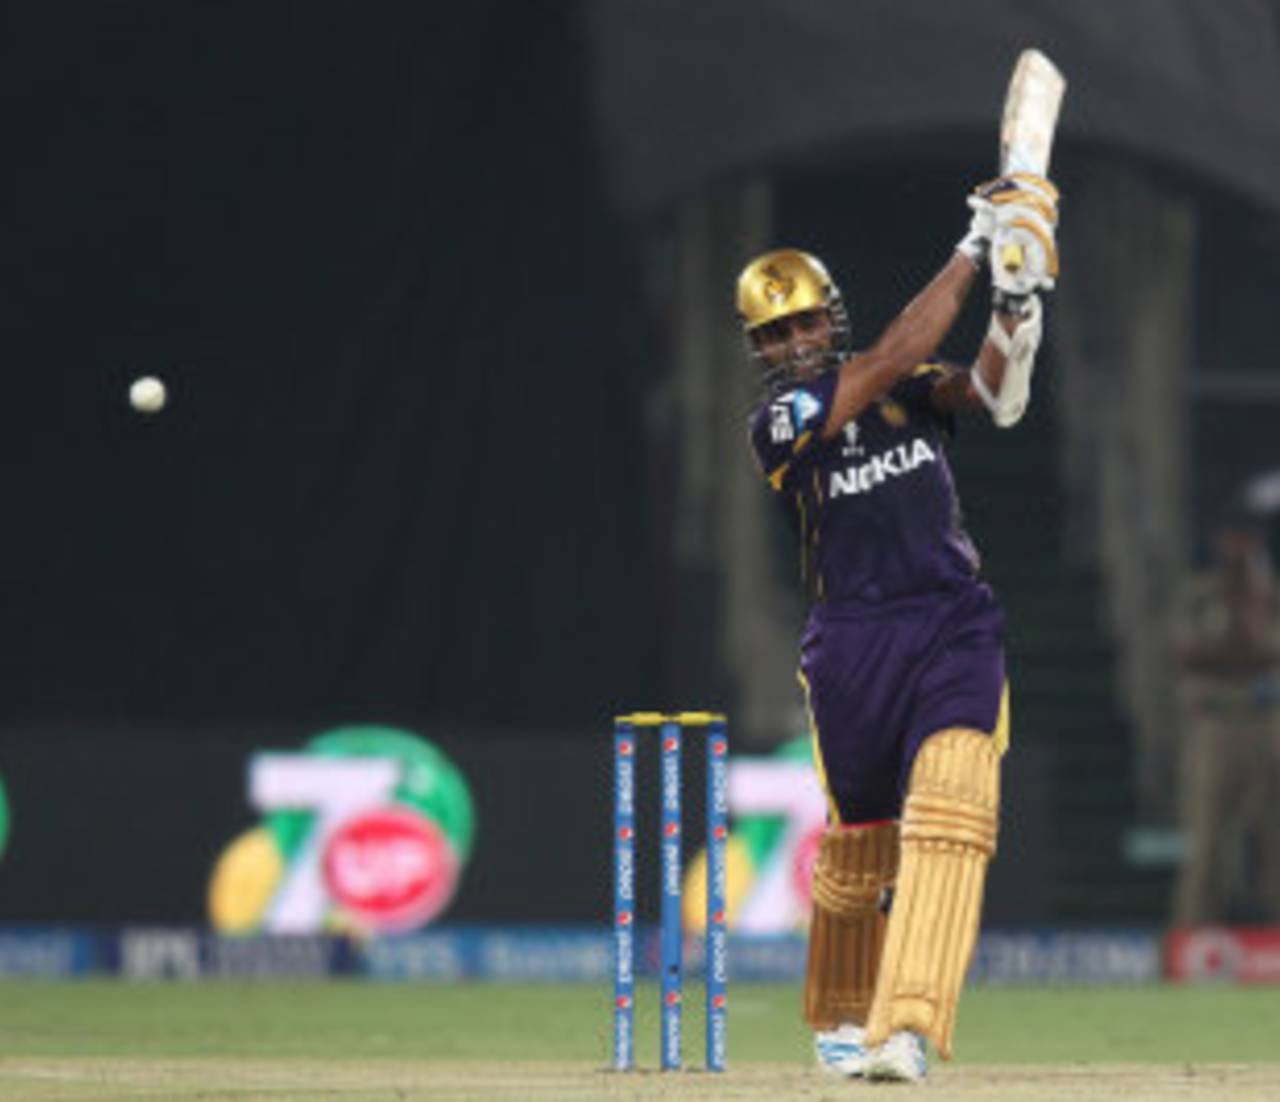
Robin Uthappa's form at the top of the order has been a huge factor in Kolkata Knight Riders' resurgence • BCCI
The overall numbers
The final of IPL 2014 will be played between the best batting team and the best bowling team of the tournament. Kings XI Punjab have scored 2788 runs, including 117 sixes and 245 fours - all of these are the highest among all teams this year. Their run rate of 9.03 per over is also by far the best - the second-highest is Chennai Super Kings' 8.53. In terms of win-loss ratio also, Kings XI have been the top team in the competition, with 12 wins and four defeats.
Their opponents, Kolkata Knight Riders, haven't been as impressive with the bat: they've struck only 65 sixes and 208 fours, and their batting run rate is 8.10, the third-highest among all teams in this tournament. However, they are on an eight-match winning streak, and their bowling has been the major reason why they are in the final (though the top-order batting has picked up significantly as well). Knight Riders have taken 91 wickets - third among all teams in the tournament, after Kings XI (106) and Super Kings (98), though both have played an extra match. However, Knight Riders have an economy rate of 7.57, easily the best - the next-best have been Mumbai Indians with 8.02. Since the tournament moved to India, most bowling sides have struggled but Knight Riders have still kept their economy rate down to 7.73, while the next-best is Mumbai's 8.26.
While Knight Riders have struck only 65 sixes in the entire tournament, they have also been frugal in terms of conceding sixes - only 67 of them have been hit against their bowlers, again the least in the tournament; Kings XI have conceded 96.
Subtracting the run rate from the economy rate for both teams, Kings XI are marginally ahead, 0.72 to 0.53. They are again the top two teams on that yardstick, ahead of Super Kings' 0.19. Also, Knight Riders' win-loss ratio is next only to that of Kings XI, so in every way it's only fair that these two teams have made it to the final round.
| Team | Matches | W/ L | Bat ave | Run rate | Bowl ave | Econ rate |
| Kolkata Knight Riders | 15 | 10/ 5 | 28.60 | 8.10 | 24.67 | 7.57 |
| Kings XI Punjab | 16 | 12/ 4 | 30.63 | 9.03 | 24.47 | 8.31 |
The middle-over kings
In terms of batting numbers, Kings XI have been particularly strong in the middle overs: between 6.1 and 15, their run rate has been 8.77; the next-highest are Knight Riders at 7.97. In the middle overs, Glenn Maxwell has scored 426 runs at a strike rate of 189; next on the list is Robin Uthappa with 298 at a strike rate of 131. (In the Indian leg, though, Uthappa leads with 239 runs, followed by Mawell's 216.)
In the opening overs, too, Kings XI have scored considerably quicker than Knight Riders, but the return to form for Gautam Gambhir and Robin Uthappa has lifted Knight Riders in the Indian leg: the team has averaged 52.44 at a rate of 7.86 since returning to India, compared to Kings XI's 43.14 and 9.15. During this period, Uthappa has scored 558 runs from ten innings at an average of 62 and a strike rate of 144, while Maxwell has 252 from ten innings at an average of 25.20 and a strike rate of 175.
However, while Kings XI have been strong at the start with the bat, they have also conceded plenty with the ball in the first six: their economy rate of 8.70 in the Powerplays is the worst among all teams; Knight Riders have an economy rate of 7.12, the best among all sides. In the last five, too, Knight Riders have by far the best economy rate - 8.39, while the next-best are Sunrisers Hyderabad at 9.14. Kings XI, meanwhile, have conceded 10.02. Knight Riders' success is largely because of Sunil Narine, who has bowled 156 balls during the last five, and taken 14 for 156. Gambhir has kept about two of his overs for the end, and that tactic has worked superbly throughout the tournament - no other bowler has bowled as many balls during the slog overs. (Click here for the tournament batting and bowling stats for Knight Riders, and here for Kings XI.)
| First 6 overs | 6.1 to 15 overs | 15.1 to 20 overs | ||||
| Average | Run rate | Average | Run rate | Average | Run rate | |
| Kolkata Knight Riders | 35.16 | 7.03 | 32.45 | 7.97 | 20.13 | 10.06 |
| Kings XI Punjab | 36.26 | 8.68 | 33.00 | 8.77 | 23.33 | 10.04 |
| First 6 overs | 6.1 to 15 overs | 15.1 to 20 overs | ||||
| Team | Average | Run rate | Average | Run rate | Average | Run rate |
| Kolkata Knight Riders | 32.05 | 7.12 | 31.37 | 7.43 | 15.38 | 8.39 |
| Kings XI Punjab | 33.44 | 8.70 | 24.66 | 7.19 | 18.51 | 10.02 |
KKR's spin advantage
Knight Riders have the obvious advantage in terms of bowling firepower, especially in the spin department. Their spinners have taken 43 wickets at an economy rate of 6.58, compared to Kings XI's 29 wickets at an economy rate of 7.41. Twenty of the 43 wickets belong to Narine, at an economy rate of 6.01.Kings XI's quick bowlers have taken 69 wickets, 15 more than the seamers from any other team, but they've also leaked 8.58 runs per over. In the Indian leg, they've been even more expensive, going at 9.32 to the over.
| Overall | In India | |||||
| Wickets | Average | Econ rate | Wickets | Average | Econ rate | |
| Kolkata Knight Riders | 36 | 34.38 | 8.09 | 23 | 35.08 | 8.31 |
| Kings XI Punjab | 69 | 24.75 | 8.58 | 41 | 29.41 | 9.32 |
| Overall | In India | |||||
| Wickets | Average | Econ rate | Wickets | Average | Econ rate | |
| Kolkata Knight Riders | 43 | 21.81 | 6.58 | 27 | 24.66 | 6.72 |
| Kings XI Punjab | 29 | 28.89 | 7.41 | 22 | 27.81 | 7.20 |
The Narine factor
And finally, a look at how Kings XI's current batsmen have fared against Narine. Sehwag has gone after Narine, and done it fairly successfully, while George Bailey has been more circumspect, scoring at a run a ball. Maxwell has done well against him too, scoring 42 from 33 without being dismissed (16 from 13 in this tournament). How these batsmen - and David Miller - go against Narine in a big game could well decide the result of the final on Sunday.
| Runs | Balls | Dismissals | Average | Run rate | |
| Virender Sehwag | 30 | 14 | 0 | - | 12.85 |
| George Bailey | 36 | 35 | 1 | 36.00 | 6.17 |
| Glenn Maxwell | 42 | 33 | 0 | - | 7.63 |
| David Miller | 15 | 11 | 1 | 15.00 | 8.18 |
| Runs | Balls | Wickets | Average | Econ rate | |
| Right-handers | 266 | 264 | 13 | 20.46 | 6.04 |
| Left-handers | 94 | 97 | 7 | 13.42 | 5.81 |
S Rajesh is stats editor of ESPNcricinfo. @rajeshstats