Runs and sixes galore, but grief for fast bowlers
Batsmen had a generally dominant season in IPL 2014, with the sixes count exceeding 700 for only the second time
S Rajesh
03-Jun-2014
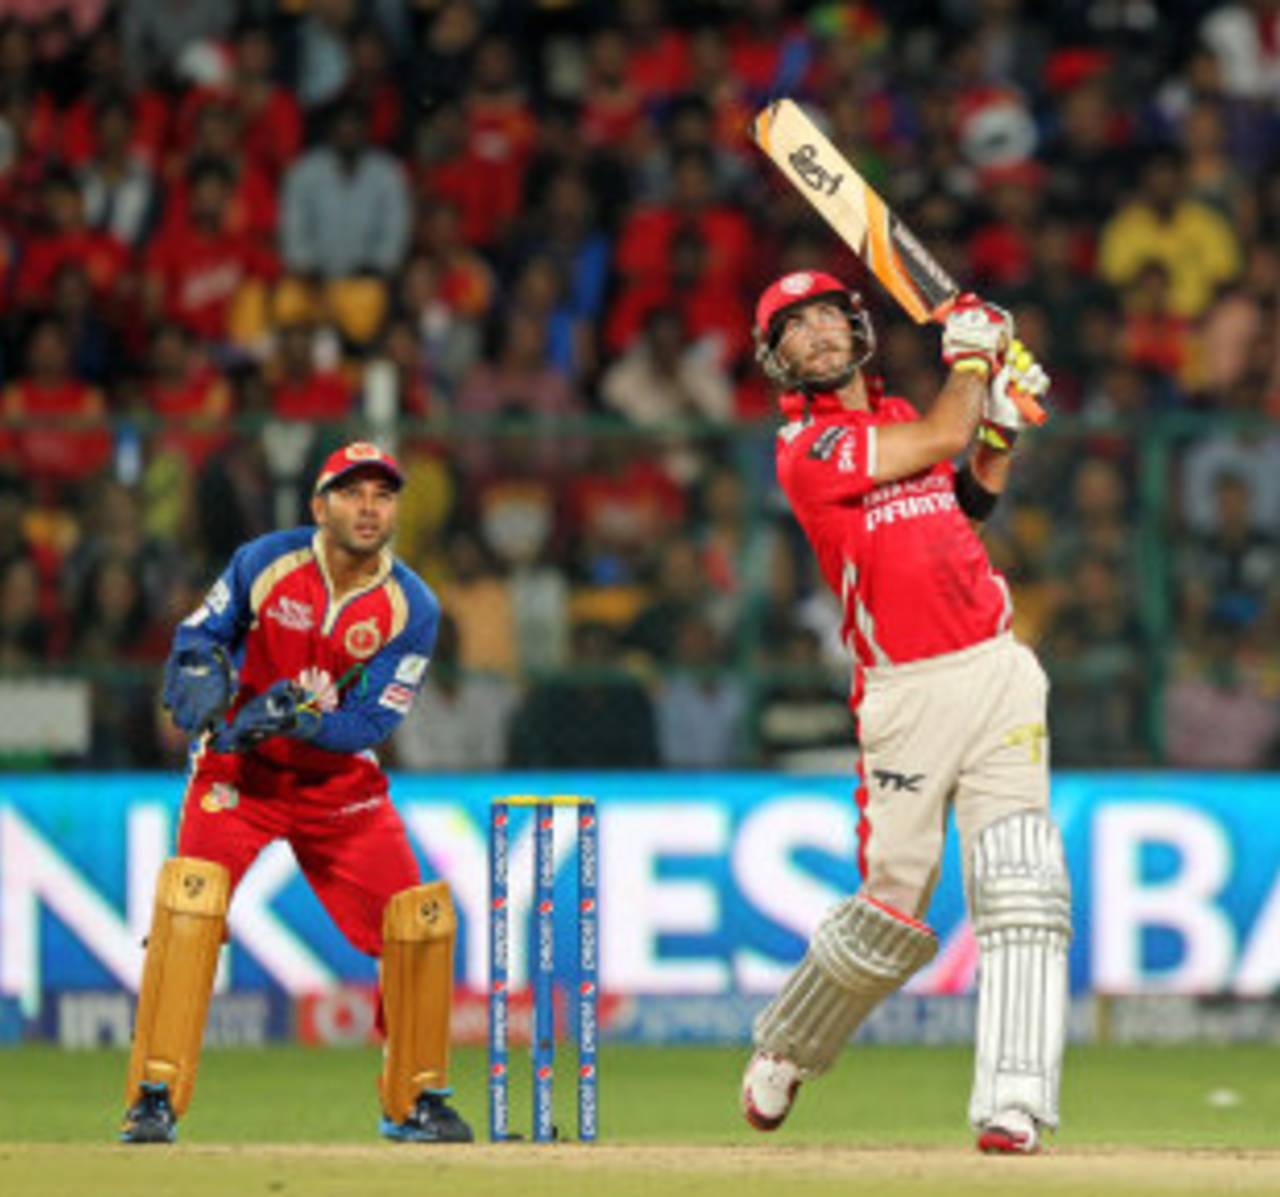
Glenn Maxwell struck 36 sixes in the tournament, the most by any batsman this season • BCCI
Over the last few IPL seasons, there's been plenty of talk about how bowlers have held their own in a format which is heavily stacked against them, but IPL 2014 was largely about batsmen dominating. It didn't start that way when the tournament was in the UAE, but the momentum shift in favour of batting was clear the moment the bandwagon shifted to India. The scores became bigger, the ball cleared the boundary far more often, and the bowlers - especially the faster ones - struggled. The overall result was a tournament run rate of 8.20, which is the second-best in IPL history. The highest was 8.30, in the inaugural edition in 2008, but since then and before this year the rate was less than eight in four out of five years.
The overall tournament run rate this time was 8.20, but that's been brought down by the UAE leg: in the 40 games played in India, the rate was 8.52, almost a run more than in the first 20 games. With the seamers getting more assistance in the UAE, the scores were generally kept to manageable proportions: in 40 innings, only 12 times did teams score 160 or more, a percentage of 30; on the other hand, in 80 innings in India, there were 47 scores of 160 or more (59%).
On the smaller grounds in India, the batsmen found it much easier to hit sixes too: in the UAE, there was an average of 8.65 sixes per match; in India, it increased to 13.5 per match. Thanks to the flurry of sixes in India, the total for the tournament exceeded 700 for only the second time in IPL history: it was 714 this year, second only to 731 in 2012, but there'd been 15 more matches in 2012. Going at the rate of 13.5 sixes per match, there'd have been 916 sixes this year, had the tournament consisted of 75 matches. (Click here for the list of highest totals this year.)
There were also an unusually large number of matches won by the team batting second this time - the teams chasing had a 37-22 win-loss record, and it was fitting that the tournament ended with Knight Riders chasing down 200. The win-loss ratio of 1.68 is the best ever for chasing teams, marginally better than the ratio of 1.63 in 2008. (These ratios exclude matches which were tied and decided by the Super Over). Last year the win-loss was 37-37, and in 2012 it was 40-34.
| Season | Matches | Runs | Wickets | Average | Run rate | 4s/ 6s |
| 2008 | 58 | 17,937 | 689 | 26.03 | 8.30 | 1703/ 622 |
| 2009 | 57 | 16,320 | 697 | 23.41 | 7.48 | 1316/ 506 |
| 2010 | 60 | 18,864 | 720 | 26.20 | 8.12 | 1709/ 585 |
| 2011 | 73 | 21,154 | 813 | 26.01 | 7.72 | 1913/ 639 |
| 2012 | 75 | 22,453 | 857 | 26.19 | 7.82 | 1911/ 731 |
| 2013 | 76 | 22,541 | 909 | 24.79 | 7.67 | 2052/ 673 |
| 2014 | 60 | 18,909 | 671 | 28.18 | 8.20 | 1562/ 714 |
| Matches | Runs | Wickets | Average | Run rate | 4s/ 6s | |
| In the UAE | 20 | 5804 | 235 | 24.69 | 7.55 | 464/ 173 |
| In India | 40 | 13,105 | 436 | 30.05 | 8.52 | 1098/ 541 |
The tournament was largely dominated by batsmen and by tall scores, but the team that won was the one with the best bowling attack. Knight Riders were the only team with an economy rate of less than eight, and while their batting run rate was only the third-best, their bowlers ensured they seldom had to chase tall targets. Kings XI, on the other hand, had a run rate of 9.09, which is the highest by any team in a season across all editions of the IPL, and the first time a team has touched nine. However, their economy rate of 8.42 was also the second-worst among all teams this year, next only to Delhi Daredevils' 8.71. However, despite the poor economy rate, the positive difference between the run rate and economy rate was highest for Kings XI - at 0.67, they were marginally better than Knight Riders' 0.52. Kings XI also had the best win-loss ratio in the tournament, and were the only team to take 100-plus wickets (though they also played at least one match more than any other side this year).
The batting might of Kings XI shone through most strongly in the middle overs (6.1 to 15), where they were clearly the best team of the tournament, scoring at 8.93 runs per over - the second-best were Knight Riders with an average of 8.19. Of the 11 instances this year when teams scored 90 or more runs during this stage of their innings, seven were by Kings XI. This includes the final, when they scored 99 in those nine overs.
Similarly, the biggest advantage for Knight Riders was their bowling in the last five overs of an innings, when they conceded only 8.73 runs per over, and also took 41 wickets. Six out of eight teams conceded more than ten runs per over during that stage, while Sunrisers went at 9.14. Sunil Narine didn't have a memorable final with the ball, but in all the other matches he was superb in the last overs, taking 14 wickets at an average of 12.92 and an economy rate of 6.46. He also bowled 28 overs at the death; no other bowler in the tournament bowled more than 21 during the last five overs of an innings.
| Team | W/ L | Runs | Run rate | Wkts taken | Econ rate | RR-ER |
| Kolkata Knight Riders | 11/ 5 | 2488 | 8.24 | 95 | 7.72 | 0.52 |
| Kings XI Punjab | 12/ 5 | 2987 | 9.09 | 113 | 8.42 | 0.67 |
| Chennai Super Kings | 10/ 6 | 2650 | 8.53 | 98 | 8.34 | 0.19 |
| Mumbai Indians | 7/ 8 | 2353 | 8.08 | 73 | 8.02 | 0.06 |
| Rajasthan Royals | 7/ 7 | 2155 | 7.99 | 84 | 8.07 | -0.08 |
| Sunrisers Hyderabad | 6/ 8 | 2102 | 7.99 | 76 | 8.28 | -0.29 |
| Royal Challengers Bangalore | 5/ 9 | 2093 | 7.78 | 73 | 8.07 | -0.29 |
| Delhi Daredevils | 2/ 12 | 2081 | 7.64 | 59 | 8.71 | -1.07 |
The dot-ball factor
Among batsmen who faced at least 150 balls in IPL 2014, Knight Riders' Shakib had the lowest dot-ball percentage, of marginally under 27%. Most of the batsmen in the list below are those who play in the middle order, which is understandable as they don't usually bat during the Powerplay, when fielding restrictions increase the likelihood of dot balls.
Batsmen with very similar dot-ball percentage have fairly different strike rates, though, which indicate the scoring patterns - specifically the boundary-hitting tendencies - of different batsmen. For instance, Faf du Plessis and AB de Villiers have similar dot percentages, but de Villiers has a strike rate which is 30 more than du Plessis'. That's because de Villiers struck 26 fours and 24 sixes in the 249 balls he faced, compared to du Plessis' 26 fours and seven sixes in 235 deliveries.
| Batsman | Balls | Dots | Average | Strike rate | Dot % |
| Shakib Al Hasan | 152 | 41 | 32.42 | 149.33 | 26.97 |
| JP Duminy | 305 | 86 | 51.25 | 134.33 | 28.20 |
| Faf du Plessis | 235 | 67 | 33.67 | 128.33 | 28.51 |
| AB de Villiers | 249 | 74 | 35.90 | 158.50 | 29.72 |
| David Miller | 299 | 91 | 49.55 | 149.00 | 30.43 |
| MS Dhoni | 250 | 77 | 74.20 | 148.33 | 30.80 |
| Glenn Maxwell | 294 | 91 | 34.50 | 187.67 | 30.95 |
| Ambati Rayudu | 287 | 89 | 25.78 | 125.67 | 31.01 |
| George Bailey | 190 | 60 | 28.55 | 135.17 | 31.58 |
| David Warner | 375 | 119 | 48.00 | 140.67 | 31.73 |
Among the bowlers, Morne Morkel had the highest dot percentage, among those who bowled at least 30 overs. The list below is dominated by the quick bowlers, which is again expected since they bowl during the Powerplay overs, when the fielding restrictions ensure a higher number of dots. However, they also tend to go for more boundaries, because of which some of the economy rates are in excess of eight.
Also, bowlers with similar dot percentages have very different economy rates. Sandeep Sharma, for instance, has a dot-ball percentage of almost 47, but an economy rate of 8.81; Lasith Malinga, with a dot percentage of 44.26, has an economy rate of 6.45. That's because of the number of boundaries conceded by them: while Sandeep went for 40 fours and 14 sixes in 241 balls, Malinga conceded only 22 fours and six sixes in 235. Like Sandeep, Varun Aaron also went for plenty of boundaries, especially in India - 27 fours and 12 sixes in 220 balls - due to which his economy rate exceeds eight despite a dot-ball percentage of more than 44.
| Bowler | Balls | Dots | Wickets | ER | Dot % |
| Morne Morkel | 288 | 154 | 12 | 7.64 | 53.47 |
| Bhuvneshwar Kumar | 319 | 159 | 20 | 6.65 | 49.84 |
| Wayne Parnell | 181 | 89 | 6 | 7.39 | 49.17 |
| Ishwar Pandey | 252 | 121 | 6 | 7.57 | 48.02 |
| Sandeep Sharma | 241 | 113 | 18 | 8.81 | 46.89 |
| Dale Steyn | 336 | 154 | 11 | 7.69 | 45.83 |
| Mitchell Starc | 322 | 143 | 14 | 7.49 | 44.41 |
| Lasith Malinga | 235 | 104 | 16 | 6.45 | 44.26 |
| Varun Aaron | 220 | 97 | 16 | 8.15 | 44.09 |
| Harbhajan Singh | 330 | 144 | 14 | 6.47 | 43.64 |
| Mitchell Johnson | 321 | 140 | 17 | 8.29 | 43.61 |
| Sunil Narine | 384 | 166 | 21 | 6.35 | 43.23 |
| Akshar Patel | 396 | 169 | 17 | 6.13 | 42.68 |
Tough going for pace
In the UAE leg of the tournament, the fast bowlers and medium-pacers savoured the conditions, taking 156 wickets at 23.32 and an economy rate of 7.35, but it was all downhill in India, where they averaged 35.64 at an economy rate of 8.81. Those are the worst numbers for fast bowlers in any IPL season, but thanks to the UAE leg, the overall economy rate is 8.29, which is still the second-highest in any IPL season. For the spinners, the shift to India didn't make such a huge impact: in the UAE they averaged 32.17 at an economy rate of 7.42.
Overall, spinners also bowled more this season - they contributed 40% of the total overs, compared with 29% last year and 35.5% in 2012. The small boundaries in India and the lack of assistance in the pitches were challenges that the fast bowlers struggled to overcome this season.
| Pace | Spin | |||||
| Year | Wickets | Average | Econ rate | Wickets | Average | Econ rate |
| 2008 | 467 | 28.42 | 8.05 | 134 | 30.38 | 8.18 |
| 2009 | 388 | 26.25 | 7.65 | 226 | 24.77 | 6.77 |
| 2010 | 405 | 29.64 | 8.32 | 210 | 28.80 | 7.34 |
| 2011 | 449 | 28.62 | 7.79 | 268 | 27.60 | 7.11 |
| 2012 | 531 | 27.09 | 7.79 | 241 | 31.35 | 7.41 |
| 2013 | 604 | 26.78 | 7.78 | 225 | 26.17 | 6.88 |
| 2014 | 377 | 30.54 | 8.29 | 229 | 30.31 | 7.57 |
The team-wise bowling stats indicate that Knight Riders' spinners did an excellent job, taking 46 wickets at an economy rate of 6.82. Apart from Narine, Shakib also had a superb tournament with the ball, bowling 50 overs at an economy rate of 6.68. The only other team whose spinners went at less than seven an over were Rajasthan Royals. The team for which spin was a huge disappointment was Sunrisers: Amit Mishra finished with an economy rate of 9.06, while the spinners for the team had a combined economy rate of 8.21, the joint-highest with Daredevils.
Kings XI's seamers fetched 71 wickets, easily the highest among all teams, but they also went for plenty of runs, conceding 8.70 per over. In the UAE they took 28 wickets at an average of 17.92 and an economy rate of 7.20, but in India they leaked 9.45 per over, and conceded 30.95 per wicket. The difference in those numbers was largely the reason why they had a perfect 5-0 win-loss in the UAE, but only 7-5 in India.
| Pace | Spin | |||||
| Team | Wickets | Average | Econ rate | Wickets | Average | Econ rate |
| Kolkata Knight Riders | 37 | 35.59 | 8.18 | 46 | 22.91 | 6.82 |
| Kings XI Punjab | 71 | 25.81 | 8.70 | 33 | 27.66 | 7.54 |
| Chennai Super Kings | 50 | 25.64 | 8.44 | 40 | 31.07 | 7.91 |
| Mumbai Indians | 42 | 33.69 | 8.12 | 25 | 35.00 | 7.41 |
| Rajasthan Royals | 54 | 30.14 | 8.14 | 21 | 22.61 | 6.98 |
| Sunrisers Hyderabad | 46 | 29.97 | 8.07 | 23 | 35.43 | 8.21 |
| Royal Challengers Bangalore | 47 | 29.27 | 8.06 | 20 | 36.90 | 7.58 |
| Delhi Daredevils | 30 | 42.90 | 8.59 | 21 | 39.42 | 8.21 |
S Rajesh is stats editor of ESPNcricinfo. @rajeshstats