Spinners make Powerplay impact
Spinners picked 40 wickets in the first six overs, the second-highest across 10 editions. Overall, they outdid pacers both in terms of average and economy rate
S Rajesh
22-May-2017
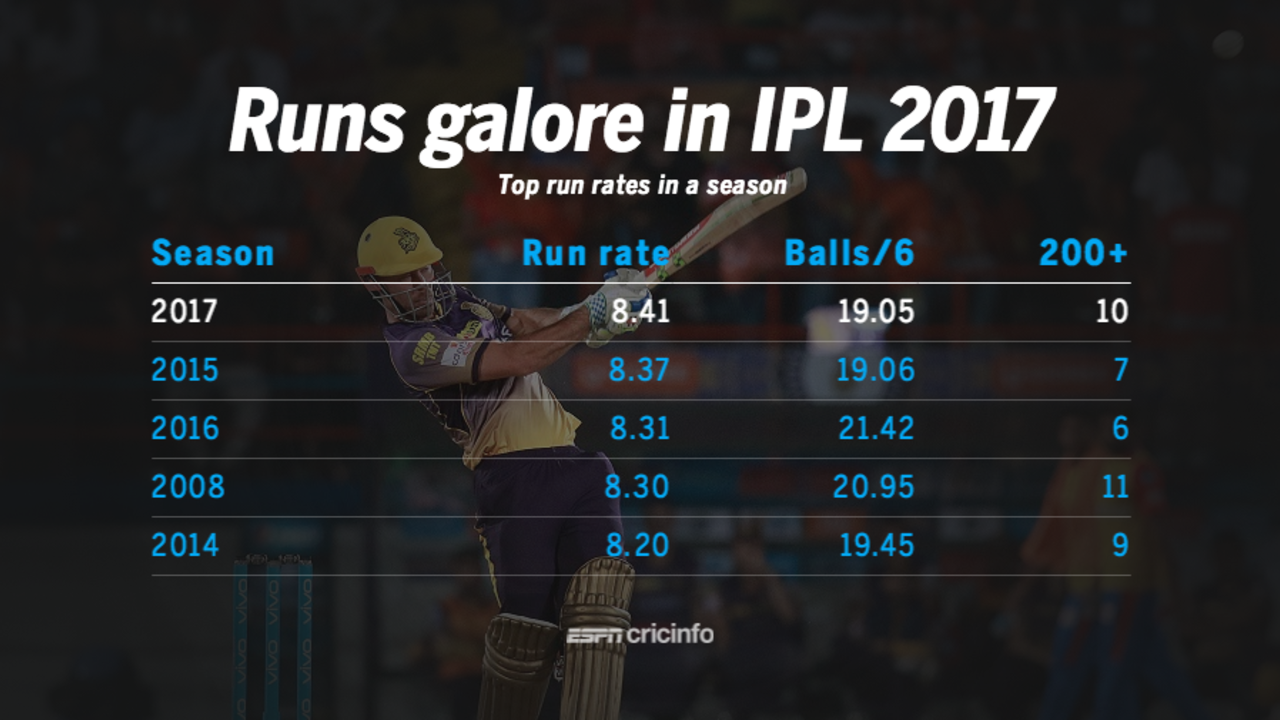
The run rate in IPL 2017 was higher than in any previous season • ESPNcricinfo Ltd
8.41 The run rate in IPL 2017, the highest among all seasons. It was marginally higher than the 2015 rate of 8.37. The three highest run rates have come in the last three seasons.
26 Matches, out of 59, won by the side batting first. The chasing side won 32, while one was tied and decided by the Super Over. The win-loss ratio of 0.812 sixth-highest in 10 seasons, but it is much better than the 2016 ratio of 0.463, when the teams batting first had a 19-41 win-loss record. Mumbai Indians (4-2) and Rising Pune Supergiant (5-3) had the best records when batting first, while Gujarat Lions lost all seven such games. Mumbai Indians and Kolkata Knight Riders had identical 7-3 chasing records.
19.05 Balls per six this season, the least among all IPL seasons; it was marginally lower than in 2015, when a six was hit every 19.06 balls. Last year, the corresponding rate was 21.42.
26 Sixes hit by Glenn Maxwell and David Warner, the joint-most this season. However, Maxwell faced only 179 balls to Warner's 452. Rishabh Pant was third in the list with 24 sixes followed by Kieron Pollard's 22. Among the 43 batsmen who faced 150 balls or more, Maxwell had the best rate of hitting sixes - one every 6.88 balls, followed by Hardik Pandya, Chris Lynn, and Pant.
8.33 The average run rate in the first six overs this season, the highest across 10 editions. The previous highest was 7.89 in 2010. The team with the highest rate in the first six this season was Knight Riders (9.39), while Royal Challengers Bangalore's 6.84 was the lowest.
7.12 Rising Pune's run rate in the middle overs (7th to 15th) this season, the lowest among all teams. In the final, they scored only 45 (losing one wicket) in the middle overs, their lowest when they faced all nine overs during this period. The overall run rate in the middle overs this season was 7.87, second only to 7.98 in the inaugural season. The last-five-overs run rate in 2017 was 9.64, fifth among all seasons.
| Season | 0.1 to 6 | 6.1 to 15 | 15.1 to 20 |
| 2017 | 8.33 | 7.87 | 9.64 |
| 2016 | 7.70 | 7.85 | 10.16 |
| 2015 | 7.75 | 7.83 | 10.31 |
| 2014 | 7.54 | 7.74 | 10.03 |
| 2013 | 6.93 | 7.23 | 9.57 |
| 2012 | 7.22 | 7.39 | 9.52 |
| 2011 | 7.20 | 7.44 | 9.10 |
| 2010 | 7.89 | 7.56 | 9.58 |
| 2009 | 7.22 | 6.85 | 9.13 |
| 2008 | 7.70 | 7.98 | 9.94 |
218 Wickets for spinners this season, at an average of 27.97 and an economy rate of 7.62. Their strike rate of 22 balls per wicket was third among all seasons, after 2009 and 2015 (21.9 in each of those seasons). The seamers took 432 wickets at a similar average (28.53), but at a much poorer economy rate (8.6).
40 Wickets for spinners in the first six overs, the second-highest across 10 editions. They took 49 in 2011, but that was a longer tournament that featured 10 teams. In terms of strike rate, 2017's figure of 23.75 balls per wicket in the Powerplays is second among all seasons, marginally behind 2015's strike rate of 23.04. Last year, spinners had far lesser success in the first six overs, taking 22 wickets at an average of 49.04 and an economy rate of 8.3 (compared to this season's 40 wickets at 30.37, economy of 7.67). Spinners also bowled a higher percentage of the Powerplay overs this season: 22%, compared to 18% in 2016.
| Pace | Spin | |||||
| Season | Wkts | Ave | ER | Wkts | Ave | ER |
| 2017 | 129 | 35.24 | 8.28 | 40 | 30.37 | 7.67 |
| 2016 | 125 | 34.98 | 7.42 | 22 | 49.04 | 8.30 |
| Season | Wickets | Average | Econ rate |
| 2011 | 49 | 27.02 | 6.62 |
| 2017 | 40 | 30.37 | 7.67 |
| 2010 | 31 | 29.61 | 6.85 |
| 2012 | 31 | 46.22 | 6.79 |
| 2013 | 27 | 36.11 | 6.44 |
| 2015 | 25 | 30.72 | 8.00 |
| 2014 | 25 | 37.40 | 6.82 |
| 2016 | 22 | 49.04 | 8.30 |
| 2009 | 18 | 26.94 | 6.56 |
| 2008 | 7 | 37.42 | 8.73 |
47 The dot-ball percentage for Washington Sundar, the highest among the 31 bowlers who bowled at least 30 overs in the tournament. The next best was Jaydev Unadkat with 46%, while Umesh Yadav and Pawan Negi had dot percentages of 44 each.
187 Runs scored by Manoj Tiwary in the last five overs, the most by a batsman in the death overs this season. He scored them off 118 balls (SR 158.5), while the next highest was Hardik Pandya (176 off 99). Among the batsmen who scored 100-plus runs in the last five, Chris Morris had the best strike rate (120 off 58, SR 206.9), while the surprise packet in these overs was Hashim Amla - he scored 90 from 36 balls, a strike rate of 250.
4 IPL trophies for Rohit Sharma - three with Mumbai Indians and one with Deccan Chargers. He is the only player who has played in four winning finals. Four others have three titles each - Lasith Malinga, Kieron Pollard, Ambati Rayudu (all with Mumbai Indians) and Yusuf Pathan (with Knight Riders and Rajasthan Royals).
S Rajesh is stats editor of ESPNcricinfo. @rajeshstats