Australia's ODI slump, and IPL's new spin
Australia may have regained their pre-eminence as a Test team, but in the one-day format the year 2009 has been an unmitigated disaster
S Rajesh
24-Apr-2009
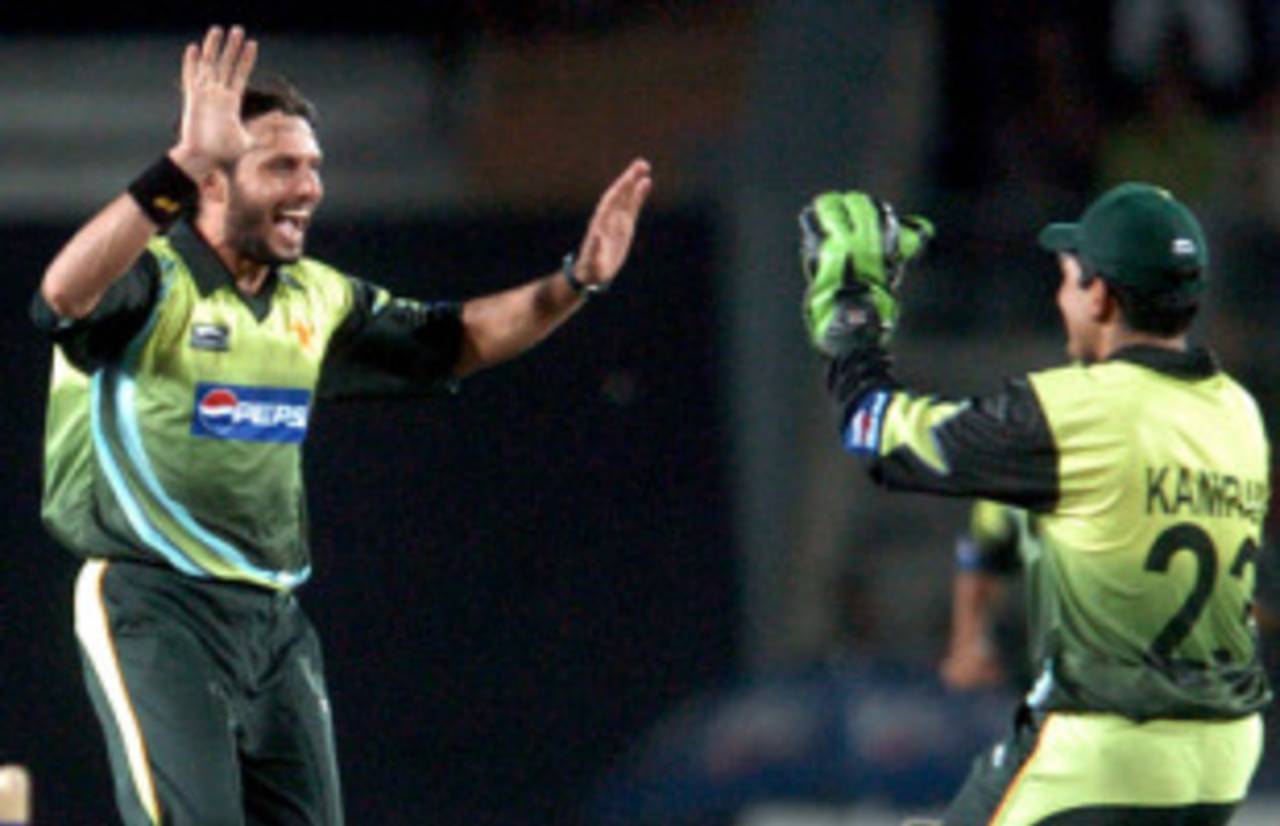
Shahid Afridi has been the latest spinner to bring the Australians to their knees • AFP
Australia may have regained their pre-eminence as a Test team with an emphatic series win in South Africa, but in the one-day format, the year 2009 has been an unmitigated disaster. First, their top spot was usurped by South Africa, and since then they've gone into such a freefall that they've lost second place as well, to India.
Less than four months into 2009, Australia have already lost 10 one-day internationals. (Click here for their results this year.) The last time they lost so many games in a year was 11 years ago, but in 1998 their 10 defeats were offset by 15 wins, which is 10 wins more than they have managed this year. In fact, Australia have never lost more than 13 ODIs in a year, but if they don't lift their game drastically, they could reach that number within the next couple of weeks.
Much of the blame for these shambolic results has been attributed to patchy batting performances, and as the innings-by-innings list shows, there have been far too many collective failures: they've been bowled out for 222, 181, 131 and 168 during this period, the last score coming against Pakistan on Wednesday. The average runs per wicket for Australia in 2009 is 29.15, which is the first time since 1997 that the number has dropped below 30.
Equally, though, the bowling has been below par too - Australia have conceded almost 35 runs per wicket, at well over five per over. It's the first time since 1998 that the bowling average has crept past 30, and it's a huge disappointment compared to the previous year's stats, when their bowling average was an excellent 20.79.
| Year | Played | Won/ lost | Bat - ave | RPO | Bowl - ave | RPO |
| 2000 | 23 | 15/ 6 | 33.38 | 5.14 | 25.02 | 4.44 |
| 2001 | 21 | 18/ 3 | 50.61 | 5.69 | 26.60 | 4.90 |
| 2002 | 29 | 19/ 8 | 34.43 | 5.12 | 24.62 | 4.42 |
| 2003 | 35 | 30/ 5 | 43.71 | 5.27 | 22.78 | 4.46 |
| 2004 | 26 | 19/ 5 | 37.45 | 5.45 | 25.05 | 4.61 |
| 2005 | 29 | 21/ 5 | 42.60 | 5.49 | 25.53 | 4.82 |
| 2006 | 29 | 20/ 8 | 37.15 | 5.30 | 26.16 | 4.89 |
| 2007 | 38 | 24/ 8 | 46.51 | 5.88 | 25.97 | 5.04 |
| 2008 | 18 | 13/ 4 | 31.53 | 4.93 | 20.79 | 4.32 |
| 2009 | 16 | 5/ 10 | 29.15 | 5.11 | 34.77 | 5.26 |
Much of the problem for Australia's batsmen this year has been combating spinners, which was further underlined by their performance against Shahid Afridi, who took 6 for 38 in the first match in Dubai. Earlier in the year, South Africa's Johan Botha and Roelof van der Merwe asked plenty of questions of Australia's batsmen, and even JP Duminy managed seven wickets in the 40 overs he bowled against them, at a pretty good economy-rate. (Click here for a look at opposition spinners against Australia this year.)
Though fast bowlers have taken 77 wickets, the Australian batsmen have played them far more easily, scoring at 5.37 runs per over. Against spin, the average and the scoring-rate are much poorer.
| Wickets | Average | RPO | Strike rate | |
| Pace | 77 | 34.53 | 5.37 | 38.5 |
| Spin | 37 | 28.83 | 4.33 | 39.8 |
As the table below indicates, almost all the top-order batsmen have had their struggles against spinners. Michael Hussey has handled them reasonably well, but Callum Ferguson has fallen to spin five times, while David Hussey, Brad Haddin, Ricky Ponting and Michael Clarke have all been dismissed four times by spinners and have ordinary averages against them. Also, none of the Australians have got a move on against spin, which means Australia have generally lost the plot in the middle overs of their innings.
In terms of overall batting, the last name in the table has been a major disappointment: Mitchell Johnson has shown plenty of ability with the bat in the Tests, but 83 runs in 10 completed ODI innings is poor returns for a batsman of his talent.
| Batsman | Overall average | RPO | Average v spin | RPO |
| Michael Hussey | 45.75 | 5.29 | 47.00 | 4.35 |
| Brad Haddin | 43.06 | 5.47 | 35.25 | 4.57 |
| Callum Ferguson | 40.85 | 5.33 | 25.20 | 4.52 |
| Shaun Marsh | 35.57 | 4.42 | 28.50 | 6.21 |
| Michael Clarke | 30.66 | 4.51 | 23.00 | 4.21 |
| Ricky Ponting | 29.28 | 4.85 | 27.00 | 4.32 |
| James Hopes | 26.50 | 5.21 | 83.00 | 3.68 |
| David Hussey | 22.66 | 4.52 | 35.00 | 3.98 |
| David Warner | 17.66 | 4.82 | - | - |
| Mitchell Johnson | 8.30 | 4.02 | 12.33 | 4.03 |
The partnership stats further illustrate where Australia have fallen short with the bat. The opening has generally been sound, with four century stands, including two in a row in the last couple of games in South Africa. However, the runs have dried up for the third, fourth and fifth wickets, with the average partnership only in the 20s or early 30s. That's further proof of how effective spinners have been against Australia.
| Wicket | Innings | Runs | Average stand | Run rate | 100/ 50 stands |
| First | 16 | 686 | 42.87 | 5.21 | 4/ 0 |
| Sixth | 14 | 528 | 40.61 | 5.36 | 0/ 6 |
| Second | 16 | 594 | 37.12 | 4.86 | 1/ 3 |
| Fifth | 16 | 439 | 31.35 | 5.27 | 0/ 3 |
| Fourth | 16 | 466 | 29.12 | 4.81 | 2/ 0 |
| Third | 16 | 388 | 24.25 | 4.70 | 0/ 2 |
| Seventh | 13 | 306 | 23.53 | 5.43 | 0/ 1 |
It hasn't been all the batsmen's fault, though: the bowlers have failed to turn it on too. Among the five bowlers who've bowled more than 50 overs this year, Johnson is the only one with a bowling average of less than 30. The big disappointment has been Nathan Bracken, with an average of more than 40 and an economy-rate of more than five.
| Bowler | Matches | Wickets | Average | Econ rate |
| Mitchell Johnson | 13 | 22 | 28.00 | 5.22 |
| James Hopes | 15 | 18 | 31.72 | 4.49 |
| Nathan Hauritz | 7 | 8 | 33.00 | 5.06 |
| Ben Hilfenhaus | 9 | 13 | 33.46 | 5.48 |
| Nathan Bracken | 15 | 16 | 41.50 | 5.16 |
Spin does the trick
The Australians aren't the only ones struggling to cope with spin. The subcontinent is supposed to be the region where slow bowlers thrive, but the second season of the IPL is turning that theory on its head. Last year there were some spinners who made significant contributions - most notably Shane Warne, Piyush Chawla and Amit Mishra - but overall, the fast bowlers did more damage, taking more wickets, and at a better average, economy-rate and strike-rate. Among the 15 leading wicket-takers, there were only two spinners.
In 2009, though, the spinners are threatening to be a much greater force. Daniel Vettori, Shane Warne, Anil Kumble, Muttiah Muralitharan, Ajantha Mendis and Pragyan Ojha have all had their moments, and have made far more decisive contributions than the fast bowlers so far, even though the weather conditions haven't exactly suited them. The pitches have been fairly dry, however, and combined with the bounce on offer, have been just perfect for spin to thrive.
| Wickets | Average | Econ rate | Strike rate | |
| Pace | 470 | 28.33 | 8.05 | 21.12 |
| Spin | 134 | 31.13 | 8.28 | 22.55 |
| Wickets | Average | Econ rate | Strike rate | |
| Pace | 72 | 25.12 | 7.95 | 18.96 |
| Spin | 28 | 18.60 | 6.35 | 17.57 |
S Rajesh is stats editor of Cricinfo