First-Test stars and flops
Batsmen who have stamped their authority on the first Test of a series, and others who have struggled
S Rajesh
17-Jul-2009
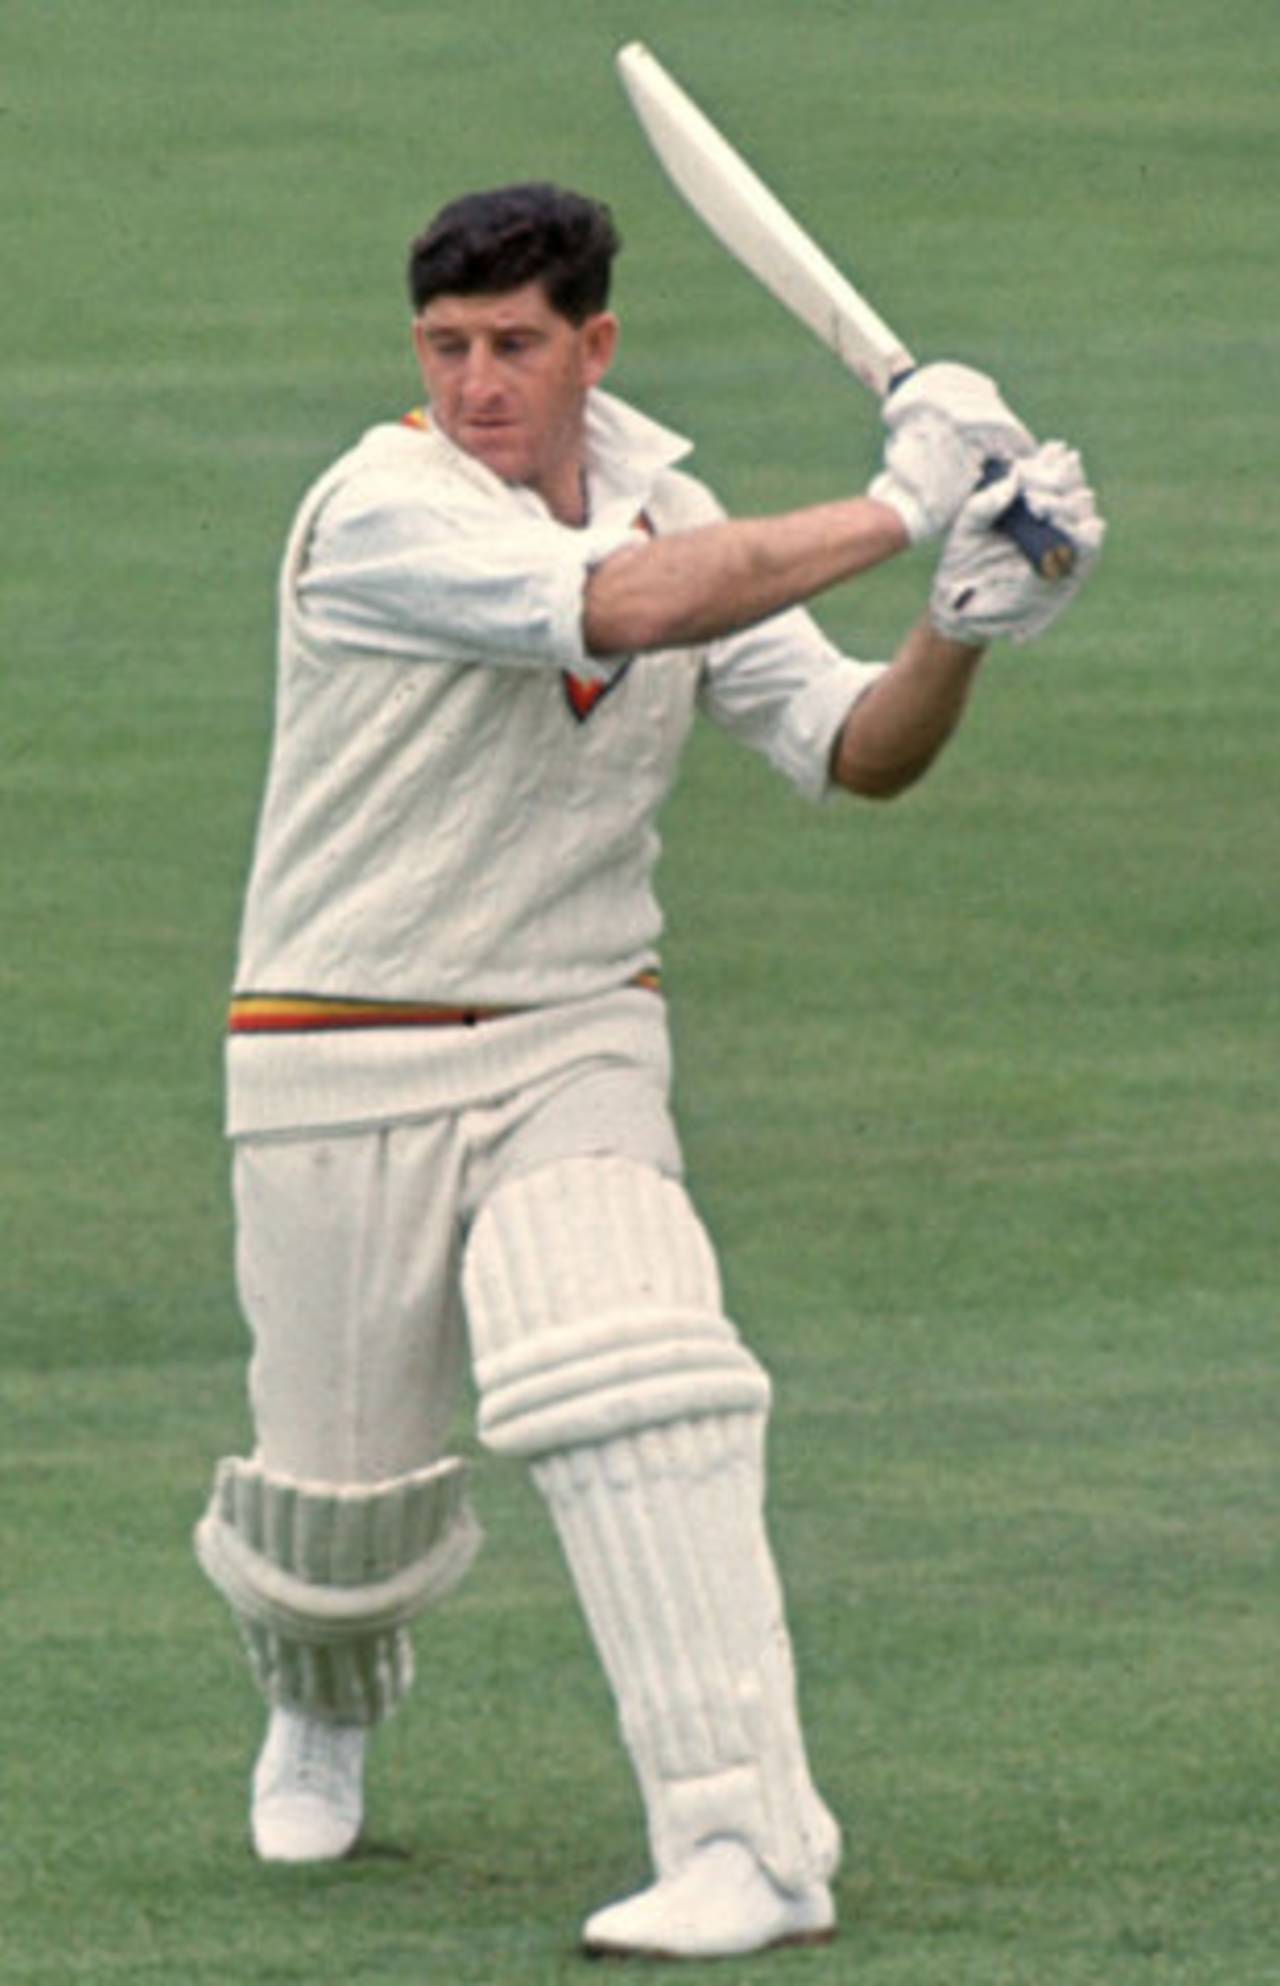
Ken Barrington averages an incredible 72.59 in series openers • Getty Images
After England had scored 435 in the first Test of the Ashes series, Australia were under a fair amount of pressure, but Ricky Ponting came out smoking, scored 150, and ensured that the visitors dominated the rest of the contest and almost emerged victorious. The first Test of a series is often the one that sets the tone for the series, and Ponting is a batsman who has historically relished the opportunity to stamp his authority on a series at the first opportunity - he averages an impressive 58.03 in the 39 first Tests that he has played (excluding one-off Tests), which is marginally higher than his overall Test average of 56.68. He has also scored 12 centuries in those 39 Tests; only Sachin Tendulkar, with 14, has scored more hundreds in the opening game of a series.
There are five batsmen, though, who have done even better than Ponting in first Tests (with a cut-off of at least 20 matches), including a couple of Australians who led the team for much of their careers. Greg Chappell averaged more than 63 in his 21 first games, and scored seven hundreds, including his highest Test score of 247 not out against New Zealand in Wellington, a match in which he scored hundreds in both innings. Mark Taylor was almost as impressive, averaging 60.71, with eight centuries in 25 Tests, though in his last four such games he only managed 153 runs in seven innings. Mahela Jayawardene, another batsman who was captain till very recently, is high up on the list as well, while India's Virender Sehwag has an excellent conversion-rate in these games, with seven hundreds out of the nine occasions when he has topped 50.
However, the leader of the group is Ken Barrington, the England middle-order batsman of the 1960s. His career average was an outstanding 58.67, but he was even better in series openers, with an amazing average of 72.59. In 20 matches, he had 15 scores of 50 or more, with centuries in each of his last two first Tests - 148 against Pakistan at Lord's and 143 against West Indies in Port-of-Spain. In fact, his average in first Tests isn't far away from that of Don Bradman, who averaged "only" 79 in the 10 first Tests he played, more than 20 runs below his career average.
| Batsman | Tests | Runs | Average | 100s/ 50s |
| Ken Barrington | 20 | 1960 | 72.59 | 8/ 7 |
| Mahela Jayawardene | 40 | 3766 | 63.83 | 11/ 16 |
| Greg Chappell | 21 | 1910 | 63.67 | 7/ 7 |
| Virender Sehwag | 22 | 2207 | 63.06 | 7/ 2 |
| Mark Taylor | 25 | 2368 | 60.72 | 8/ 13 |
| Ricky Ponting | 39 | 3424 | 58.03 | 12/ 16 |
| Adam Gilchrist | 29 | 2133 | 57.65 | 9/ 7 |
| Aravinda de Silva | 31 | 2709 | 57.64 | 10/ 8 |
| Jacques Kallis | 43 | 3555 | 57.34 | 10/ 20 |
| Javed Miandad | 37 | 2854 | 57.08 | 7/ 13 |
| Sachin Tendulkar | 51 | 3895 | 55.64 | 14/ 13 |
| Zaheer Abbas | 21 | 1755 | 54.84 | 5/ 4 |
| Michael Slater | 20 | 1689 | 54.48 | 6/ 4 |
| Andy Flower | 26 | 2176 | 54.40 | 7/ 10 |
| Garry Sobers | 20 | 1515 | 54.11 | 4/ 7 |
The difference between Ponting's first-Test average and his overall average isn't much, but for some players the difference is significant. Ian Healy leads the way with a difference of more than 18: in first Tests, his stats would do a regular batsman proud, with an average touching 46. Three of his four centuries were unbeaten ones, which helped his average as well. In other Tests, though, his average dropped by more than 50%, to 22.02, which brought his overall average down to 27.39. The difference is significant for Taylor too, whose career average was only 43.49.
The top ten is again dominated by Australians, with five of them in this list. Michael Slater averaged more than 54 in the first Test of a series, with six centuries in 20 such matches, but his overall average dropped to less than 43. Slater's first-Test numbers were even better in Ashes games, in which he scored 512 runs at 73.14 in four matches. The difference is significant, too, for Adam Gilchrist, whose first-Test average is 10 more than his overall number.
| Batsman | 1st Tests | Average | 100s/ 50s | Career ave | Difference |
| Ian Healy | 30 | 45.75 | 4/ 7 | 27.39 | 18.36 |
| Mark Taylor | 25 | 60.72 | 8/ 13 | 43.49 | 17.23 |
| Aravinda de Silva | 31 | 57.64 | 10/ 8 | 42.97 | 14.67 |
| Ken Barrington | 20 | 72.59 | 8/ 7 | 58.67 | 13.92 |
| Virender Sehwag | 22 | 63.06 | 7/ 2 | 50.06 | 13.00 |
| Michael Slater | 20 | 54.48 | 6/ 4 | 42.83 | 11.65 |
| Mahela Jayawardene | 40 | 63.83 | 11/ 16 | 52.76 | 11.07 |
| Zaheer Abbas | 21 | 54.84 | 5/ 4 | 44.79 | 10.05 |
| Adam Gilchrist | 29 | 57.65 | 9/ 7 | 47.60 | 10.05 |
| Greg Chappell | 21 | 63.67 | 7/ 7 | 53.86 | 9.81 |
| Marvan Atapattu | 34 | 47.69 | 8/ 7 | 39.02 | 8.67 |
| Graham Gooch | 26 | 50.40 | 8/ 7 | 42.58 | 7.82 |
| Imran Khan | 24 | 43.74 | 3/ 4 | 37.69 | 6.05 |
| Marcus Trescothick | 21 | 49.81 | 5/ 9 | 43.79 | 6.02 |
| Richard Hadlee | 29 | 32.55 | 1/ 6 | 27.16 | 5.39 |
At the other end of the spectrum are players who've had a tendency to begin series slowly. A couple of West Indians figure prominently on that list: Ramnaresh Sarwan has a career average in excess of 42, but in first Tests it drops to a dismal 28, with five ducks in 25 matches. He did go some way towards rectifying those numbers with a 107 against England at home this year, but scored only 13 and 1 in the return series at Lord's. Brian Lara's stats dropped significantly too in first Tests - eight of his 17 ducks came in the opening encounter. He did finish on a high, though, scoring 61 and 122 in his last such game, against Pakistan in Lahore.
Most Australian captains have done well in opening Tests, but one who didn't was Allan Border, who averaged less than 40 in these matches, compared to a career average of more than 50. The story is similar for the Waugh twins, both of whom averaged much less in first Tests than they did overall, but Steve's first-Test average of 43.31 is still higher than Mark's overall average of 41.81.
Another significant first-Test failure has been India's VVS Laxman, whose first-Test average is a disappointing 35.90, well below his career average. Much of that is due to his abysmal conversion-rate in these games - he has 11 fifty-plus scores, but only one of those is a hundred, against Zimbabwe in Bulawayo. In his last 10 such innings, he has only one half-century.
| Batsman | 1st Tests | Average | 100s/ 50s | Career ave | Difference |
| Ramnaresh Sarwan | 25 | 28.02 | 2/ 8 | 42.32 | -14.30 |
| Allan Border | 38 | 39.40 | 5/ 12 | 50.56 | -11.16 |
| Brian Lara | 34 | 42.14 | 6/ 12 | 52.88 | -10.74 |
| Wasim Raja | 20 | 25.90 | 1/ 2 | 36.16 | -10.26 |
| VVS Laxman | 36 | 35.90 | 1/ 10 | 45.24 | -9.34 |
| Shaun Pollock | 35 | 23.95 | 0/ 2 | 32.31 | -8.36 |
| Allan Knott | 22 | 24.47 | 1/ 4 | 32.75 | -8.28 |
| Wally Hammond | 20 | 50.54 | 4/ 3 | 58.45 | -7.91 |
| John Edrich | 21 | 35.77 | 2/ 7 | 43.54 | -7.77 |
| Steve Waugh | 44 | 43.31 | 8/ 11 | 51.06 | -7.75 |
| Mark Waugh | 34 | 34.54 | 3/ 12 | 41.81 | -7.27 |
| Colin Cowdrey | 26 | 37.09 | 3/ 8 | 44.06 | -6.97 |
| Richie Richardson | 20 | 37.60 | 2/ 7 | 44.39 | -6.79 |
| Sourav Ganguly | 38 | 35.58 | 5/ 7 | 42.17 | -6.59 |
| Mudassar Nazar | 22 | 31.72 | 3/ 4 | 38.09 | -6.37 |
And then there are those whose numbers don't change much at all. For Matthew Hayden, for example, the difference is a miniscule 0.07. His conversion-rate in first Tests is something Laxman could learn from - 10 centuries, and only three half-centuries.
| Batsman | 1st Tests | Average | 100s/ 50s | Career average | Difference |
| Matthew Hayden | 31 | 50.66 | 10/ 3 | 50.73 | -0.07 |
| Graham Thorpe | 27 | 44.56 | 4/ 9 | 44.66 | -0.10 |
| David Boon | 27 | 43.83 | 6/ 7 | 43.65 | 0.18 |
| Geoff Boycott | 27 | 48.05 | 3/ 12 | 47.72 | 0.33 |
| Saleem Malik | 32 | 44.03 | 5/ 7 | 43.69 | 0.34 |
| Rod Marsh | 24 | 27.00 | 1/ 3 | 26.51 | 0.49 |
| Michael Atherton | 26 | 38.21 | 3/ 12 | 37.69 | 0.52 |
| Allan Lamb | 21 | 35.52 | 4/ 2 | 36.09 | -0.57 |
| Arjuna Ranatunga | 33 | 36.39 | 3/ 10 | 35.69 | 0.70 |
| Moin Khan | 26 | 29.35 | 1/ 7 | 28.55 | 0.80 |
Only batsmen with a career average of more than 25 were considered.
S Rajesh is stats editor of Cricinfo