Mumbai best among equals ... so far
Mumbai have lost only a third of the wickets that their bowlers have taken, which shows how dominant they've been in the first two weeks of IPL 2011
S Rajesh
22-Apr-2011
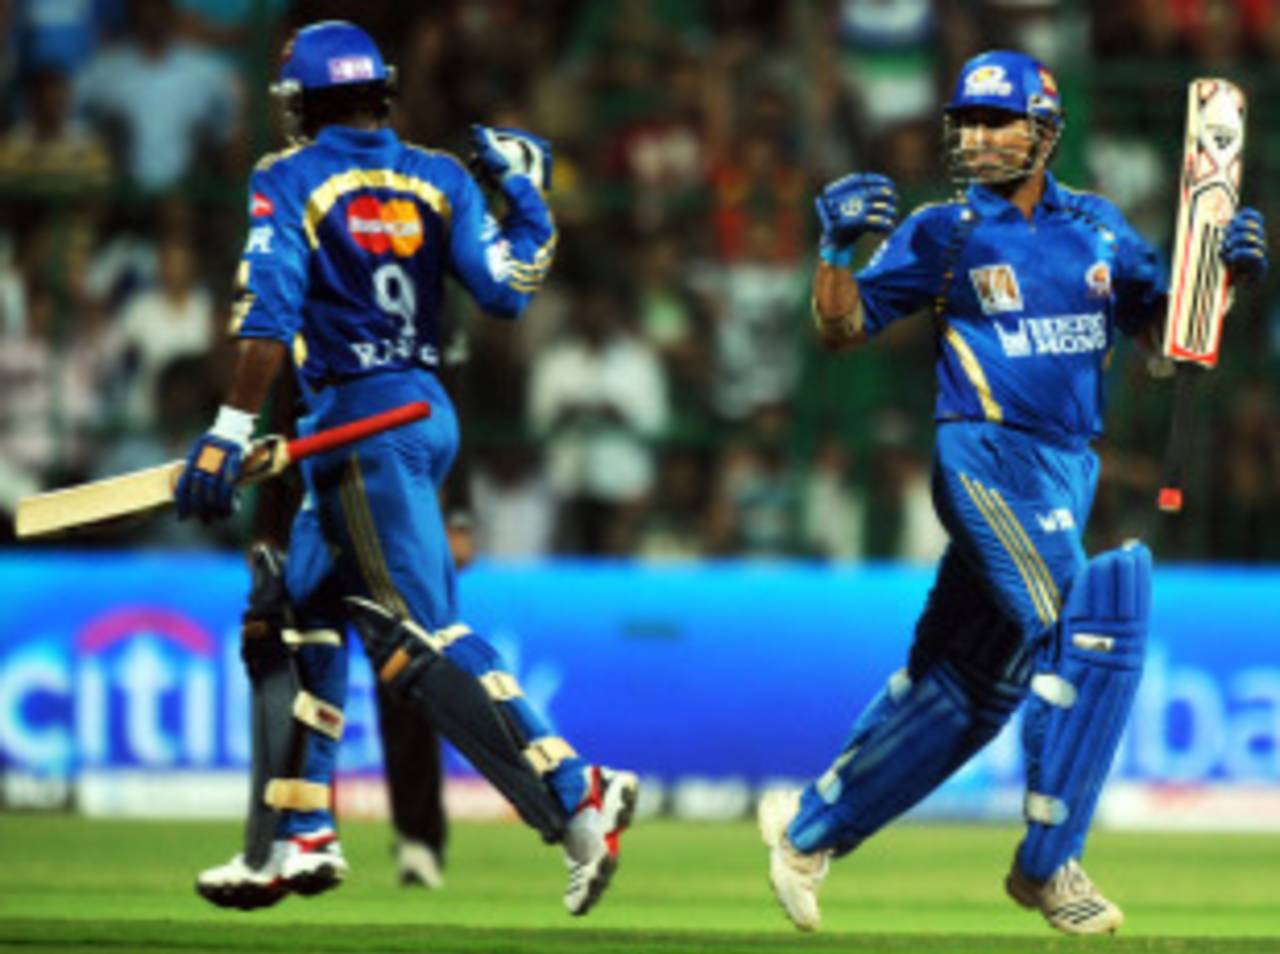
Ambati Rayudu and Sachin Tendulkar have ensured there have been few hiccups for Mumbai's batsmen in the first part of this year's IPL • AFP
It's still fairly early days in IPL 2011, but one team has clearly set the early benchmarks: Mumbai Indians have won three games extremely convincingly, and with Sachin Tendulkar and Lasith Malinga leading their batting and bowling, they, quite clearly, have the best numbers in the tournament so far.
Mumbai are joint leaders in the points table with six, and are one of only two teams to have lost one match so far. Kings XI Punjab have the same win-loss record and points, but in terms of batting and bowling numbers Mumbai are well clear of all sides, though Punjab have surprised many with their resurgence after a poor start. Other teams have scored more runs at a faster rate, but that's only because Mumbai's bowlers have ensured their batsmen don't have to do a lot. In their three wins so far, they've chased targets of 96, 141, and 119. They allowed Pune Warriors to get closer than they should have in their last match, but Mumbai have still lost only eight wickets in IPL 2011, and only four of their batsmen have been dismissed so far. Andrew Symonds has faced only 15 deliveries so far, while Rohit Sharma has played 48.
Overall, Mumbai's bowlers have taken three times the number of wickets their team has lost with the bat, which is why their bowling average is so much better than their batting one. That also means the difference between their batting index (batting average multiplied by runs scored per ball) and their bowling index (bowling average multiplied by runs conceded per ball) is easily the highest among all teams - in fact, it's almost seven times the value of the next-best side.
Kolkata are that team, thanks largely to their wonderfully disciplined bowling unit, which has accounted for 30 wickets (excluding run-outs), the most by any team in the tournament so far. No side has touched 160 against them, and they also bowled out Rajasthan Royals for 81, the lowest total of this IPL and the third-lowest in all IPL matches. The Kolkata bowlers' combined economy rate of 6.92 runs per over is also the lowest by any bowling unit in the tournament so far. The difference between the two indices for them is 6.69 - considerably lower than Mumbai's, but far better than any other side. In fact, Punjab and Chennai Super Kings are the only other side whose difference between the batting and bowling index is greater than zero.
At the other end of the table are Royal Challengers Bangalore and Delhi Daredevils, two teams which have struggled for form and momentum. Both teams were among the top contenders in the last couple of years, but this year the batting and bowling have been problem areas. Only a couple of players from both teams have topped 100 runs - David Warner and Venugopal Rao for Delhi, and AB de Villiers and Virat Kohli for Bangalore - while their two star openers have largely been flops so far - Virender Sewhag for Delhi and Tillakaratne Dilshan for Bangalore. The bowling for both teams have been poor too, with averages exceeding 40 and the economy rates touching eight.
| Team | Runs scored/wkts lost | Bat ave/ SR | Ave x SR/100 (I1) | Wkts taken | Bowl ave/ER | Ave x ER/6 (I2) | I1-I2 |
| Mumbai Indians | 507/ 8 | 63.37/ 111.92 | 70.92 | 24 | 21.54/ 6.98 | 25.06 | 45.86 |
| Kolkata Knight Riders | 641/ 23 | 27.86/ 115.08 | 32.06 | 30 | 22.00/ 6.92 | 25.37 | 6.69 |
| Kings XI Punjab | 624/ 21 | 29.71/ 133.90 | 39.78 | 22 | 27.50/ 8.26 | 37.86 | 1.92 |
| Chennai Super Kings | 640/ 17 | 37.64/ 138.22 | 52.03 | 18 | 35.33/ 8.57 | 50.46 | 1.57 |
| Pune Warriors | 534/ 24 | 22.25/ 126.84 | 28.22 | 22 | 25.31/ 7.02 | 29.61 | -1.39 |
| Deccan Chargers | 769/ 33 | 23.30/ 127.52 | 29.71 | 24 | 30.75/ 7.64 | 39.16 | -9.45 |
| Kochi Tuskers Kerala | 716/ 25 | 28.64/ 126.50 | 36.23 | 20 | 36.35/ 7.69 | 46.59 | -10.36 |
| Rajasthan Royals | 637/ 27 | 23.59/ 113.54 | 26.78 | 22 | 32.40/ 7.72 | 41.69 | -14.91 |
| Royal Challengers Bangalore | 561/ 24 | 23.37/ 117.61 | 27.49 | 16 | 40.81/ 8.31 | 56.52 | -29.03 |
| Delhi Daredevils | 552/ 30 | 18.40/ 119.22 | 21.94 | 14 | 42.00/ 7.80 | 54.60 | -32.66 |
No.4 on top
It's the fourth edition of the IPL, and quite fittingly, batsmen at the No.4 slot have had a pretty enjoyable time in the tournament so far. In 40 innings, they've averaged almost 38, which is comfortably the highest among batsmen in all slots, at a strike rate of 123.
The openers have obviously scored a huge chunk of fifties and hundreds - they've managed two hundreds and 16 fifties - but the two-down batsmen have acquitted themselves very well too, with fifties for Virat Kohli, AB de Villiers, S Badrinath, Yuvraj Singh and Bharat Chipli. Manoj Tiwary hasn't scored a fifty, but he has an aggregate of 133 runs at No.4, at an average of 66.50.
| Position | Innings | Runs | Average | Strike rate | 100s/ 50s |
| Openers | 88 | 2427 | 29.96 | 122.36 | 2/ 16 |
| No.3 | 44 | 1112 | 30.05 | 123.96 | 0/ 6 |
| No.4 | 42 | 1019 | 37.74 | 123.36 | 0/ 5 |
| No.5 | 36 | 593 | 20.44 | 118.83 | 0/ 1 |
| No.6 | 31 | 499 | 22.68 | 136.71 | 0/ 1 |
| No.7 | 21 | 288 | 22.15 | 123.60 | 0/ 1 |
In terms of partnerships, though, the one for the second wicket has been the most prolific so far, with the average touching 39 at a rate of almost eight. Of the six century stands in this IPL, three have been for the third wicket. The highest partnership of this IPL has also been for the second wicket, when Gautam Gambhir and Jacques Kallis added an undefeated 152 for Kolkata against Rajasthan. Tendulkar and Rayudu have also done their bit to boost the average for the second wicket with two century stands, against Kochi and Bangalore.
| Wicket | Innings | Runs | Average stand | Run rate | 100/ 50 p'ships |
| First | 44 | 1306 | 29.68 | 7.78 | 2/ 8 |
| Second | 44 | 1585 | 37.73 | 7.73 | 3/ 10 |
| Third | 42 | 1167 | 32.41 | 7.64 | 1/ 6 |
| Fourth | 36 | 762 | 23.09 | 7.42 | 0/ 4 |
| Fifth | 31 | 829 | 36.04 | 8.59 | 0/ 4 |
| Sixth | 21 | 420 | 22.10 | 9.03 | 0/ 1 |
The Tendulkar-Rayudu pair is also the prolific in IPL 2011 so far, with a tally of 330 runs and an average stand of 110 per dismissal. The next three pairs that follow them are all those that bat at the top of the order. The leaders among them are the Adam Gilchrist-Paul Valthaty combination: in three innings they've put together partnerships of 61 (versus Chennai), 136 (against Deccan) and 67 (versus Rajasthan).
In fact, the top four teams have a pair each in the first four slots, which shows the importance of a strong top order to the fortunes of a team. That's all the more reason for Delhi and Bangalore to hope that Sehwag and Dilshan perform to potential. If they do, both these teams could make a strong comeback in a tournament that so far hasn't gone according to plan for them.
| Pair | Innings | Runs | Average stand | Run rate | 100/ 50 stands |
| Ambati Rayudu - Sachin Tendulkar (Mumbai) | 4 | 330 | 110.00 | 7.79 | 2/ 1 |
| Adam Gilchrist - Paul Valthaty (Punjab) | 3 | 264 | 88.00 | 10.92 | 1/ 2 |
| Mahela Jayawardene - Brendon McCullum (Kochi) | 4 | 229 | 57.25 | 8.22 | 1/ 0 |
| Gautam Gambhir - Jacques Kallis (Kolkata) | 2 | 191 | 191.00 | 8.95 | 1/ 0 |
| Brad Hodge - Ravindra Jadeja (Kochi) | 4 | 164 | 82.00 | 9.55 | 0/ 1 |
S Rajesh is stats editor of Cricinfo