Trial by pace for Australia and South Africa
These two teams have the best fast-bowling stats in Tests recently. A look at their pace stats, and the numbers for their batsmen against pace
S Rajesh
26-Oct-2012
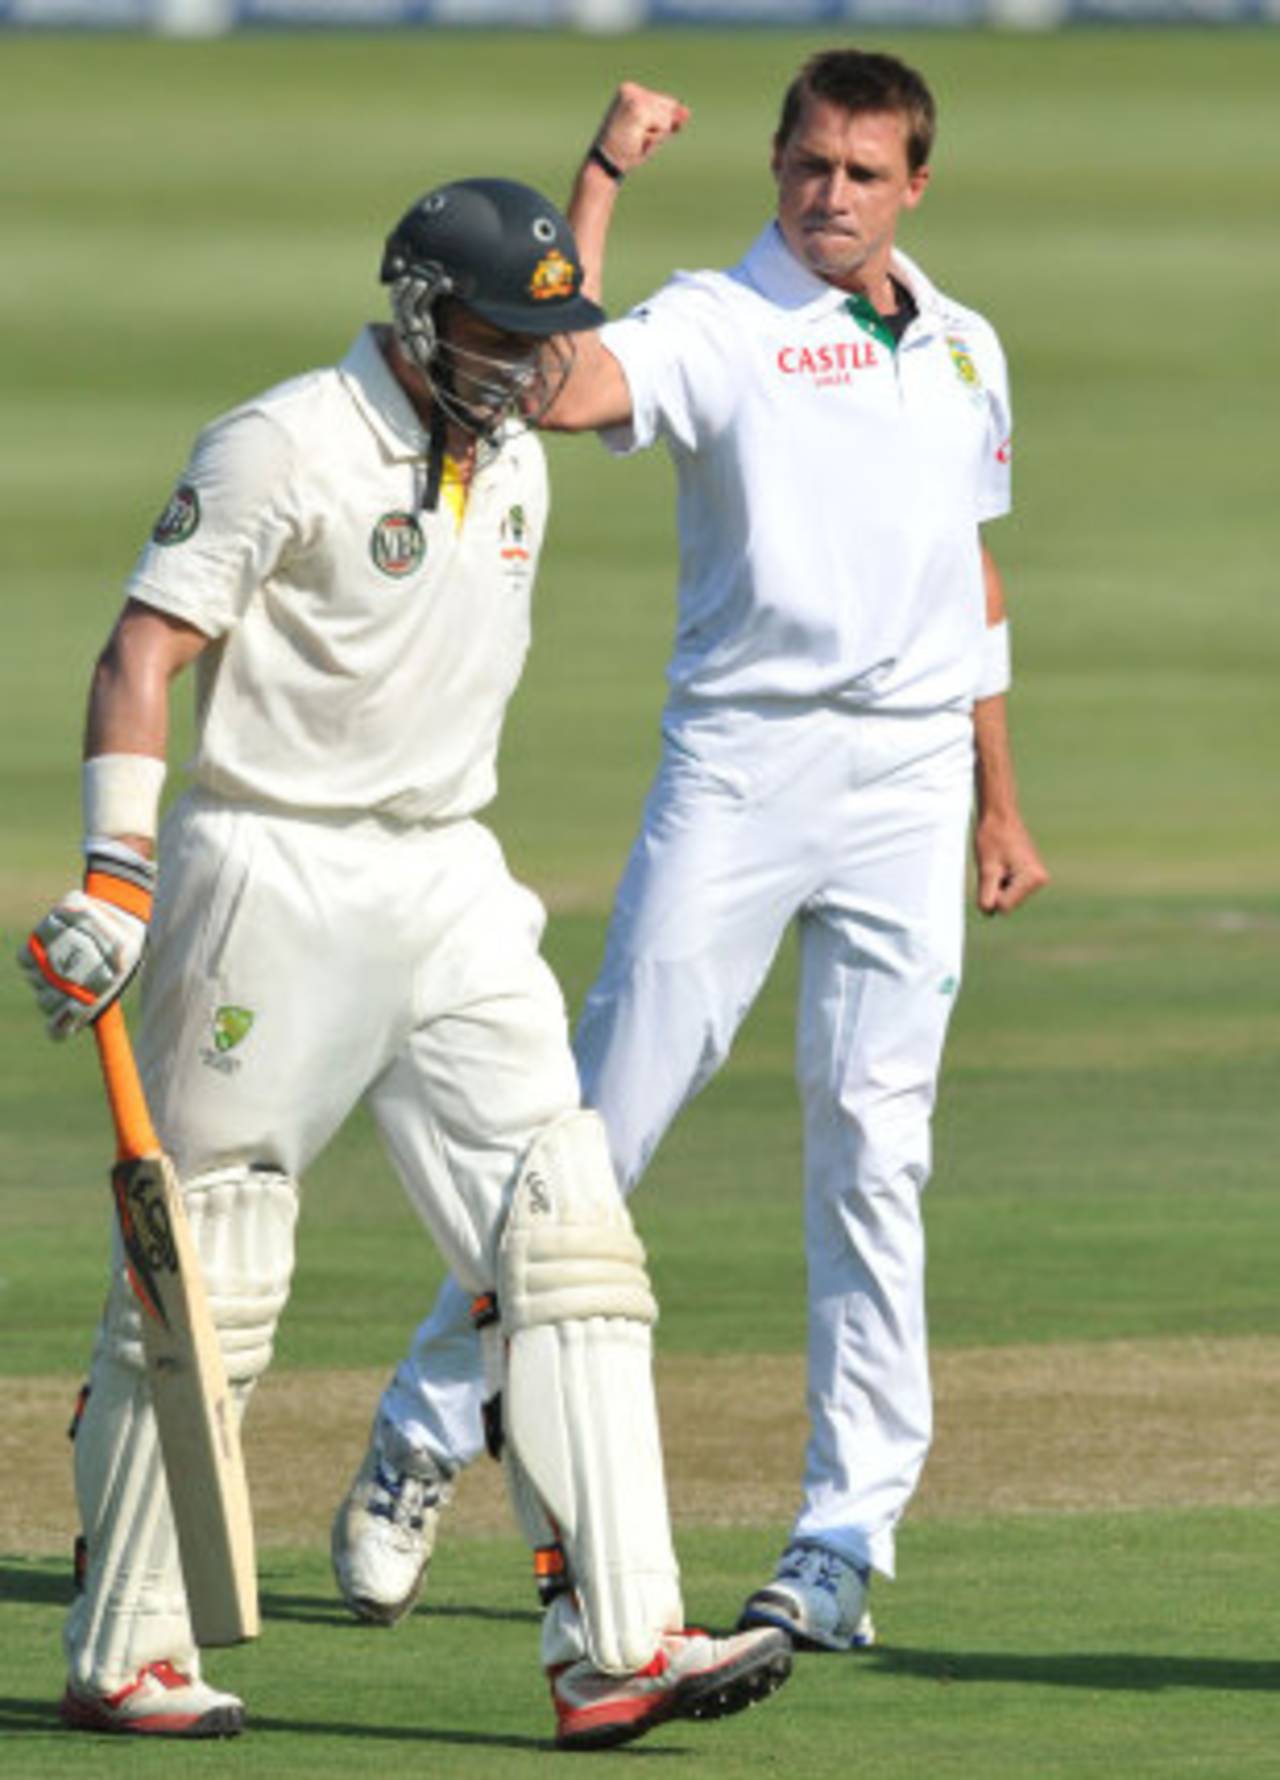
Michael Hussey has been dismissed 11 times in Tests by Steyn, Morkel or Philander, and has scored 106 runs against them. His average: 9.64 • Getty Images
In a couple of weeks' time, the focus of the cricket world will shift back to Tests as two of the best sides lock horns with the No. 1 spot on the line: if Australia win the series by any margin, they will regain the top spot, with South Africa dropping to at least No. 3.
One of the key contests, especially given the type of pitches that are likely to be served up, will be the one between the pace attacks of the two teams. South Africa have three tried and tested fast bowlers in Dale Steyn, Morne Morkel and Vernon Philander, with the uncapped Rory Kleinveldt the only other fast bowler in their squad. Australia, on the other hand, will be led by Ben Hilfenhaus and Peter Siddle, but they have the greater fast-bowling depth, with Mitchell Starc, James Pattinson and Pat Cummins all in the mix for a Test slot.
Both teams also have the best fast-bowling stats among all teams in the last 20 months. In the 2010-11 Ashes, England completely dominated the Australian bowlers in that famous 3-1 series win, but since then the Australian attack has played key roles in series wins against Sri Lanka, India and West Indies. Their performances have also helped Australia climb from fifth spot on the ICC table in January 2011, to third now.
Similarly, South Africa's attack has served them well in series wins against Sri Lanka, New Zealand, and, most crucially, in their 2-0 victory in England, when they comfortably outperformed the home team's pace attack. During this period Australia have a win-loss ratio of 4.50, and South Africa 3.00; only Pakistan come between these two.
In terms of the overall averages of fast bowlers during this period, Australia and South Africa are bunched together very closely, with only 0.09 separating the averages of the two sides. England have fallen away a bit during this period due to their poor performances against South Africa.
| Team | Tests | Wickets | Average | Strike rate | 5WI/ 10WM |
| South Africa | 11 | 168 | 24.61 | 48.6 | 11/ 2 |
| Australia | 14 | 186 | 24.70 | 52.1 | 8/ 0 |
| England | 18 | 214 | 29.25 | 61.3 | 7/ 1 |
| West Indies | 18 | 174 | 31.02 | 61.5 | 7/ 1 |
| Pakistan | 14 | 88 | 31.78 | 61.0 | 3/ 0 |
| New Zealand | 11 | 122 | 32.08 | 55.9 | 6/ 0 |
| India | 16 | 134 | 38.92 | 68.1 | 4/ 1 |
| Sri Lanka | 17 | 98 | 50.84 | 86.7 | 2/ 0 |
Among the fast bowlers who have taken at least 25 Test wickets during this period, the six best averages all belong to bowlers from Australia and South Africa, which indicates how dominant their pace attack has been. Australia have also had significant contributions from Nathan Lyon, their offspinner, who has taken 42 wickets at 27.83, but much of the damage has been inflicted by pace. After an utterly insipid Ashes series, Hilfenhaus has rediscovered himself and has taken 37 wickets at 18.18, while Siddle has been the leading wicket-taker for Australia with 43 at 24.39. Ryan Harris has been outstanding too - especially in overseas Tests - with 27 wickets at 23.07, but a shoulder surgery is likely to keep him out of the South Africa series.
South Africa's attack has been bolstered significantly by the addition of Philander, who has so far had an unbelievable run in Tests - his 63 wickets have come at a rate of 33 balls per wicket, overshadowing even Steyn's 49 wickets at a strike rate of 49. Morkel's stats are relatively modest compared to those of Philander and Steyn - 37 wickets at an average of 30.78.
The best among the quick bowlers from other sides is Stuart Broad, with 73 wickets from 17 Tests at 25.30. (Click here for the full list of fast bowlers who have taken 25 or more wickets during this period.)
| Bowler | Tests | Wickets | Average | Strike rate | 5WI/ 10WM |
| Vernon Philander | 10 | 63 | 15.96 | 33.1 | 7/ 2 |
| Ben Hilfenhaus | 7 | 37 | 18.18 | 43.6 | 2/ 0 |
| James Pattinson | 5 | 26 | 18.96 | 33.8 | 2/ 0 |
| Ryan Harris | 7 | 27 | 23.07 | 51.3 | 1/ 0 |
| Peter Siddle | 10 | 43 | 24.39 | 47.9 | 1/ 0 |
| Dale Steyn | 11 | 49 | 24.87 | 49.1 | 2/ 0 |
With so much onus on fast bowlers, the winner of this contest will also depend on which team bats better against pace. Here's a look at the stats of batsmen from these two teams against pace in Tests overs the last five years.
At the very outset it needs to be mentioned that the averages against pace depend on the quality of quick bowling that batsmen from these two sides have encountered in these five years. While most batsmen in the list below have similar averages against pace and against all types of bowling since 2008, there's one notable exception. Michael Hussey has had a bit of a slump during this period, with his average dropping from 80.58 before 2008 to 41.93 in 54 Tests since then, but even that average is much better than his numbers against pace during this period: his average against seam and swing bowling drops to 33.26, more than eight below his overall average during this period.
Even more worrying are Hussey's stats against South Africa's three leading quick bowlers: Steyn, Morkel and Philander have dismissed him 11 times, conceding just 106 runs, which means Hussey's average against them is a measly 9.64. Steyn and Morkel have accounted for ten of those 11 dismissals, conceding 101 runs.
For most of the others, the overall averages over these five years are fairly close to their averages against pace. Michael Clarke, Graeme Smith, Hashim Amla and AB de Villiers have higher averages against pace than their overall average since the beginning of 2008, but Jacques Kallis' average against seam and swing drops by around four runs (compared to his overall average) as does Ricky Ponting's. Hussey, Ponting and Kallis have all been terrific batsmen but are all older than 37, which suggests age might have slightly slowed their reflexes and made them more susceptible against pace. With a key series coming up, though, their captains will be hoping otherwise.
| Batsman | Runs | Dismissals | Average | Run rate | Overall ave* |
| Michael Clarke | 2769 | 53 | 52.24 | 3.25 | 49.72 |
| Graeme Smith | 2650 | 45 | 58.88 | 3.77 | 55.70 |
| Hashim Amla | 2563 | 42 | 61.02 | 3.43 | 58.26 |
| Ricky Ponting | 2553 | 67 | 38.10 | 3.69 | 42.09 |
| AB de Villiers | 2194 | 33 | 66.48 | 3.53 | 61.12 |
| Michael Hussey | 2096 | 63 | 33.26 | 2.87 | 41.93 |
| Jacques Kallis | 1977 | 40 | 49.42 | 2.97 | 54.17 |
| Shane Watson | 1660 | 43 | 38.60 | 3.40 | 38.74 |
| Alviro Petersen | 891 | 17 | 52.41 | 3.26 | 42.39 |
| David Warner | 555 | 11 | 50.45 | 4.58 | 42.14 |
| JP Duminy | 549 | 14 | 39.21 | 2.72 | 37.57 |
| Jacques Rudolph | 426 | 11 | 38.72 | 3.15 | 37.14 |
S Rajesh is stats editor of ESPNcricinfo. Follow him on Twitter