Australia's Watson dilemma
In 2009 and 2010, Shane Watson was Australia's best Test batsman, but since then his average is the lowest among their top-order batsmen
S Rajesh
26-Apr-2013
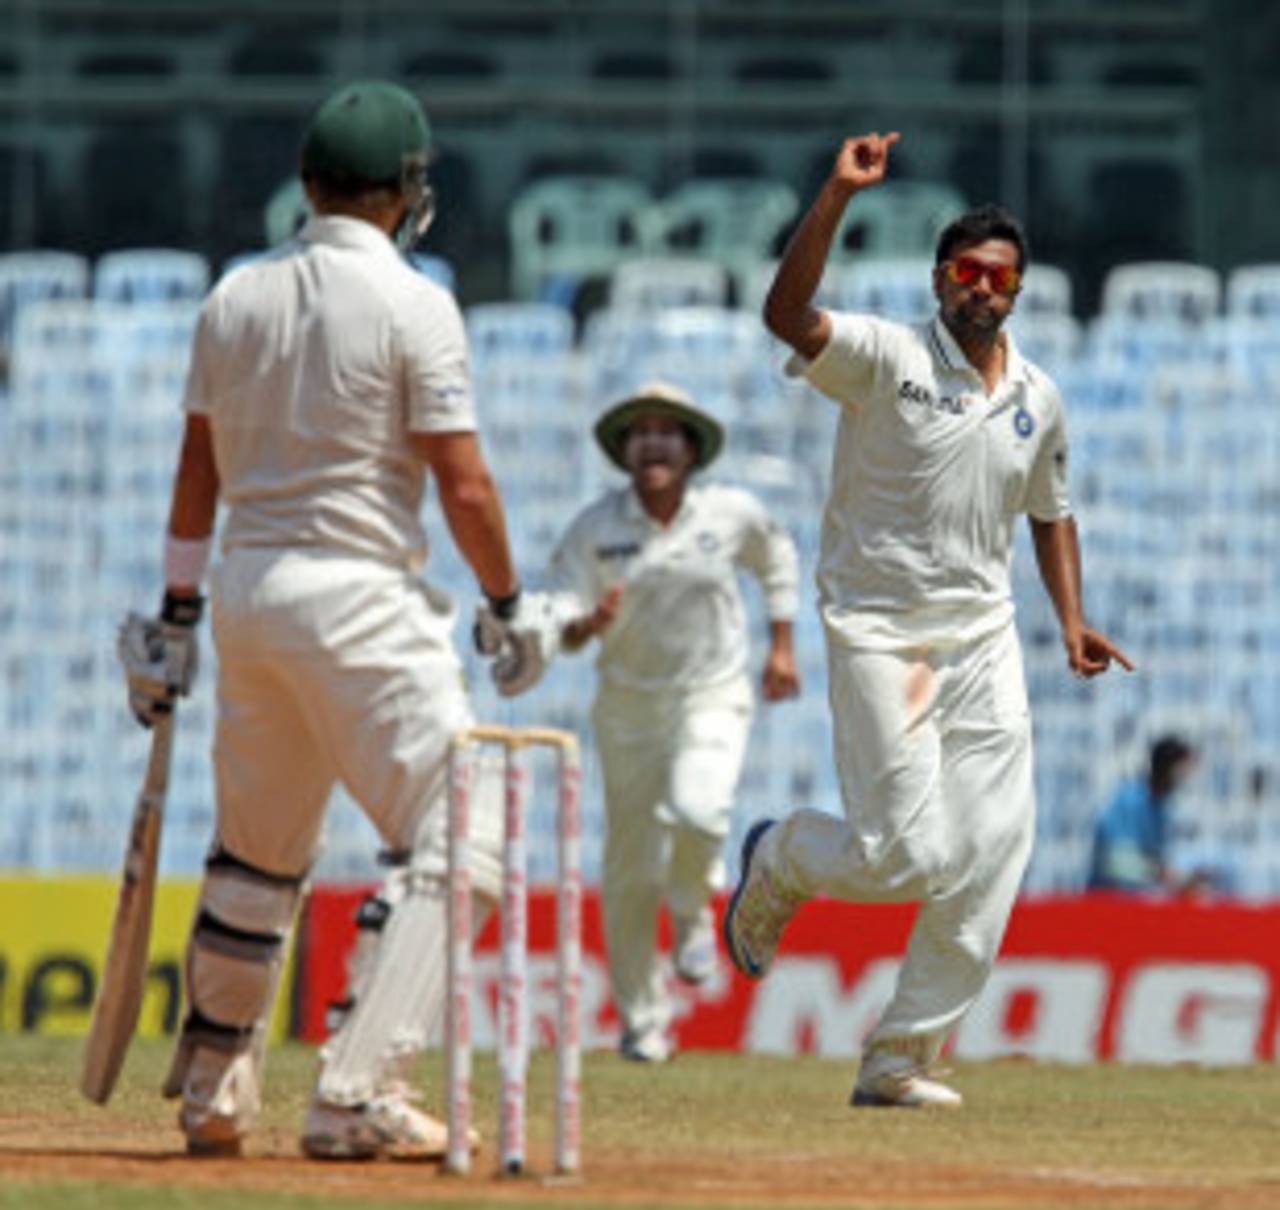
Since the beginning of 2011, Watson has been dismissed below 20 on 13 occasions in 28 Test innings • BCCI
A little more than two years ago Shane Watson was an integral part of the Australian Test set-up, consistently scoring runs, and seen as one of the senior players who'd manage the transition after the departure of some legends. In the 2010-11 Ashes at home, though Australia were beaten badly, Watson was one of the few successes with the bat, getting starts almost every time and finishing with the second-highest aggregate for his team.
As it's turned out, though, that was his last substantial Test series, and the string of failures that have followed - along with the controversial incidents during the India tour - have raised serious question-marks about Watson's future as a Test player. Given that Australia have three important series coming in the next year - two against England and a tour to South Africa - they'll want a solution to this issue sooner than later. And given Watson's stats over the last couple of years, it's not difficult to see why the patience of Australia's selectors could be wearing thin.
In his last five series, plus a Test against South Africa, Watson has scored all of 710 runs in 28 innings, with a highest of 88 and an average of 25.35. In two of those series he hasn't had a half-century: in Sri Lanka in 2011 his highest was 36 in five innings, and in India earlier this year his top-score in six innings was 28. With him not bowling much either, Watson's contribution to the team in the last couple of years has been well below par.
In the couple of years before that, though, Watson was in the form of his life, averaging more than 50 and reeling off half-centuries every other innings: in 34 knocks he had 16 scores of 50 or more. He wasn't so great at converting them into hundreds, but given the slump he's in now he'll gladly take those numbers. His consistency during that period was incredible: only eight times in 34 innings was he dismissed for less than 20; in the last 28 innings, he's been dismissed for a sub-20 score 13 times.
| Period | Tests | Runs | Bat ave | 100s/ 50s | Wickets | Bowl ave |
| 2005 to 2008 | 8 | 257 | 19.76 | 0/ 1 | 14 | 35.57 |
| 2009 to 2010 | 18 | 1613 | 50.40 | 2/ 14 | 28 | 28.71 |
| 2011 to 2013 | 15 | 710 | 25.35 | 0/ 4 | 20 | 28.10 |
| Career | 41 | 2580 | 35.34 | 2/ 19 | 62 | 30.06 |
Much talk recently has veered towards the relationship between Watson and Michael Clarke, the current captain. While incidents in India justifiably brought attention to this aspect, it's also true that Watson's stats under Clarke are much poorer than his stats when Ponting was captain. Under Ponting, Watson's Test average was 41.55 - it would have been higher if not for the poor start to his Test career in his first eight matches, when he averaged less than 20. Since Clarke has taken over, Watson's average has fallen by more than 36%.
| Captain | Watson-Tests | Runs | Average | 100s/ 50s |
| Ricky Ponting | 26 | 1870 | 41.55 | 2/ 15 |
| Michael Clarke | 14 | 688 | 26.46 | 0/ 4 |
The contrast between Watson the Test batsman between 2009 and 2010, and the one since then, is striking, especially when compared with other Australian batsmen. During those two years when Watson was at the top of his game, his average was the highest among all Australian batsmen. None of the others touched 50, with Clarke averaging 45.32.
Since Clarke has taken over, though, Watson's average has slumped to 26, which puts him right at the bottom of the pile of Australians who've aggregated 500 or more runs during this period. Australia's lack of batting riches also shows through in that list. Hussey averaged almost 51 under Clarke's leadership but is no longer around, while those who are in the Ashes squad have pretty ordinary stats over this period: Ed Cowan averages 33.03, while Phil Hughes is even lower, at 28.19. Add Watson's 26.46 to this, and you have a pretty underwhelming top order which England's pace attack will fancy bowling to, especially if conditions are favourable for swing bowling.
| Batsman | Tests | Runs | Average | 100s/ 50s |
| Shane Watson | 18 | 1613 | 50.40 | 2/ 14 |
| Simon Katich | 22 | 1907 | 47.67 | 4/ 13 |
| Michael Clarke | 25 | 1813 | 45.32 | 5/ 8 |
| Michael Hussey | 25 | 1771 | 43.19 | 4/ 11 |
| Brad Haddin | 20 | 1171 | 41.82 | 2/ 7 |
| Phil Hughes | 9 | 668 | 41.75 | 2/ 2 |
| Ricky Ponting | 25 | 1666 | 37.86 | 2/ 13 |
| Marcus North | 21 | 1171 | 35.48 | 5/ 4 |
| Batsman | Tests | Runs | Average | 100s/ 50s |
| Michael Clarke | 24 | 2578 | 66.10 | 9/ 6 |
| Michael Hussey | 21 | 1630 | 50.93 | 6/ 5 |
| David Warner | 18 | 1255 | 41.83 | 3/ 7 |
| Matthew Wade | 11 | 602 | 37.62 | 2/ 3 |
| Ricky Ponting | 16 | 1015 | 37.59 | 2/ 6 |
| Ed Cowan | 16 | 925 | 33.03 | 1/ 6 |
| Phil Hughes | 14 | 733 | 28.19 | 1/ 4 |
| Shane Watson | 14 | 688 | 26.46 | 0/ 4 |
Watson's drop in form over the last couple of years has meant his overall average has fallen to 35.34; when batting in the top six it's 37.20, which is among the lowest for an Australian top-order batsman in the last two decades and more. Among batsmen who've batted at least 40 times in the top six for Australia since 1990, the only ones who average lower than Watson are Hughes and Greg Blewett, who played during a period when most sides had pretty potent bowling attacks: in the 46 Tests that Blewett played, the overall batting average was 27.33; in the 41 Tests that Watson has played, the average is 31.02. Using that as a factor, Blewett's career average of 34.02 (it's slightly different from his top-order average as he batted a couple of times at No. 7) was 1.24 times the overall average in the matches he played in; for Watson, that ratio is 1.14, which means in real terms Blewett's average is actually a touch higher than Watson's.
Similarly, the two Marks who're in the list below Watson, Taylor and Waugh, also played during an era when batting averages were lower - the overall average in the Tests Taylor played (since 1990) was 29.88, while it was 29.85 for Mark Waugh.
Watson's clearly capable of more than we've seen from him recently; the Ashes might be his last chance to convince the selectors and the Australian team management that he is worth persisting with in Test matches.
| Batsman | Tests/ Inngs | Runs | Average | 100s/ 50s |
| Phil Hughes | 24/ 45 | 1452 | 33.00 | 3/ 6 |
| Greg Blewett | 46/ 77 | 2423 | 33.19 | 3/ 15 |
| Shane Watson | 38/ 69 | 2493 | 37.20 | 2/ 19 |
| Mark Taylor | 93/ 166 | 6306 | 40.94 | 15/ 35 |
| Mark Waugh | 128/ 207 | 8026 | 42.24 | 20/ 47 |
S Rajesh is stats editor of ESPNcricinfo. Follow him on Twitter