Battle of fast bowlers in pace-friendly venue
Australia are the hot team at the moment, but they'll be up against a strong South African side who have an imposing record in Centurion, the venue for the first Test
S Rajesh
11-Feb-2014
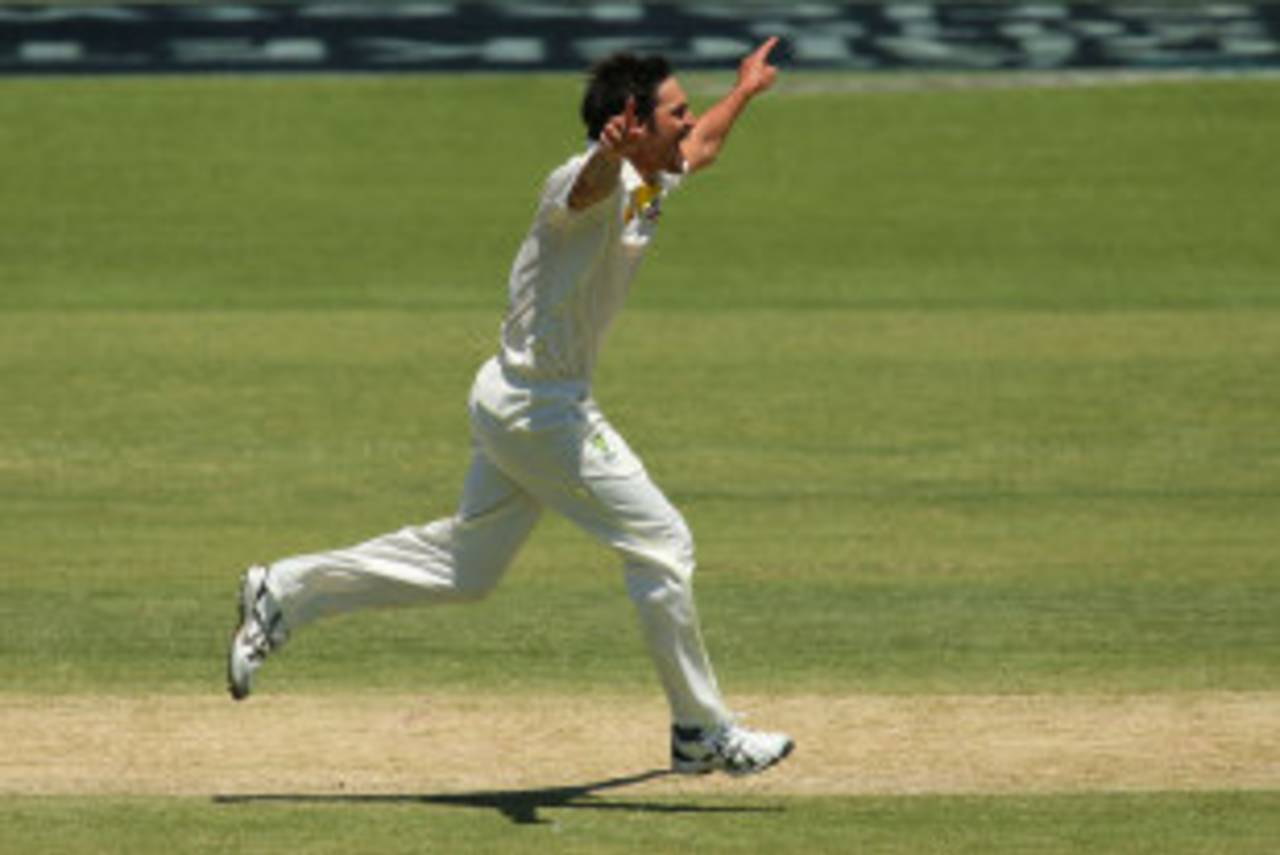
Mitchell Johnson has a mixed record in Tests in South Africa: in 2009 he took 16 wickets at 25, but in 2011-12, his three wickets cost him 85 runs each • Getty Images
They are currently the first and third-ranked teams in the ICC ratings, but recent results suggest they are the two best sides. South Africa are clearly the best team at the moment - they have won eight and drawn six of their last 14 series - but Australia are coming off a fearful hammering of England at home, and have been far more impressive than India, who are currently second in the ICC rankings. However, Australia will take that spot from India if they win the series by any margin; even a drawn series will suffice if India don't win the second Test against New Zealand and level the series. Moreover, Australia were the last team to win a series against South Africa, when they won 2-1 in South Africa in 2008-09.
The fact that the series is in South Africa makes it even spicier, given that Tests between the two countries in South Africa are rarely ever drawn. Since their readmission into international cricket, South Africa have played 17 Tests against Australia at home, of which only one has been drawn; on the other hand, six out of 18 Tests between these two teams have been drawn in Australia. The only drawn Test between these two teams during this period in South Africa was in 1994, which means the last 14 Tests here have all produced results.
No matter where they've played, though, Australia have had the upper hand, winning roughly two matches for every Test they've lost. Their batsmen have averaged almost 35 runs per wicket, and scored 19 centuries in 17 matches. South Africa have averaged 28.77 runs per wicket with the bat at home against Australia, and scored 11 hundreds; they've done better with the bat in Australia, averaging 32.92 runs per wicket.
| Tests | Aus won | SA won | Aus bat ave/ 100s | SA bat ave/ 100s | |
| Overall, since 1992 | 35 | 19 | 9 | 37.44/ 46 | 30.87/ 26 |
| In South Africa, since 1992 | 17 | 11 | 5 | 34.87/ 19 | 28.77/ 11 |
If it's a contest between these two sides, then the focus is always on the pace attacks, for that's always been the strength for both teams. Michael Clarke has announced that he feels Australia have the best pace attack in the world, but South Africa don't have a bad line-up either: Vernon Philander and Dale Steyn are the top two ranked bowlers, with Morne Morkel at No. 13. Australia have Ryan Harris at No. 3, Peter Siddle at No. 5 and Mitchell Johnson at No. 9. In the last three years, South Africa's fast bowlers have averaged 24.39 runs per wicket, compared to Australia's 26.70. Those are the two best averages among all teams, and the numbers indicate too that there's little to choose between the pace attacks of the two sides.
Moreover, these fast bowlers will have the added incentive of bowling in South Africa, where conditions have always favoured pace. In all Tests since the beginning of 2006, fast bowlers have averaged 28.87 in South Africa, the only country where they've averaged less than 30.
| Host country | Tests | Wickets | Average | Strike rate |
| South Africa | 41 | 1048 | 28.87 | 53.7 |
| New Zealand | 34 | 782 | 31.38 | 57.3 |
| Australia | 45 | 1089 | 31.94 | 59.0 |
| England | 56 | 1312 | 32.22 | 59.4 |
| West Indies | 31 | 578 | 32.37 | 63.8 |
Australia's quick bowlers have usually enjoyed the conditions here. In the last series between the two teams here - in 2011-12 - South Africa's pace attack, led by Philander and Steyn, outdid Australia's, but in the series before that, Australia's fast bowlers were clearly dominant. In 2008-09, Australia's pace attack averaged 30.80 to South Africa's 36.46, and in 2005-06, led by Stuart Clark, they were even more dominant, averaging 21.68 to South Africa's 34.35.
| Australia | South Africa | ||||||
| Season | Tests | Wickets | Average | Strike rate | Wickets | Average | Strike rate |
| 2011-12 | 2 | 24 | 32.62 | 54.4 | 34 | 22.11 | 38.2 |
| 2008-09 | 3 | 41 | 30.80 | 69.2 | 39 | 36.46 | 62.1 |
| 2005-06 | 3 | 44 | 21.68 | 43.0 | 37 | 34.35 | 63.0 |
| 2001-02 | 3 | 30 | 32.03 | 60.9 | 31 | 45.06 | 64.0 |
| 1996-97 | 3 | 29 | 23.10 | 51.1 | 37 | 27.51 | 65.2 |
| 1993-94 | 3 | 27 | 36.40 | 86.5 | 43 | 35.09 | 77.5 |
The three South African fast bowlers in the current first-choice line-up all have excellent home records, with Philander, especially, being outstanding in his first ten home Tests. Australia's spearhead, Johnson, has had a mixed time in South Africa: in 2009 he was on top of his game, taking 16 wickets at 25, but he had a terrible tour in 2011-12, taking three wickets at 85 each.
| Bowler | Tests | Wickets | Average | Strike rate | 5WI/ 10WM |
| Dale Steyn | 37 | 202 | 21.09 | 39.6 | 14/ 3 |
| Morne Morkel | 23 | 84 | 27.47 | 52.9 | 2/ 0 |
| Vernon Philander | 10 | 62 | 15.24 | 33.7 | 6/ 1 |
The batting comparison
The battle for pace-bowling supremacy is a closely contested one, with little to differentiate the two teams, but what could separate the two teams is the batting, and in that aspect South Africa look more solid, even without Jacques Kallis. In the last three years, South Africa's overall batting average of 39.03 is well clear of the other teams. Australia are in second place, just like in the pace-bowling department, but their average of 33.33 is significantly below South Africa's, who have scored 36 centuries in 24 Tests, compared to 39 in 35 Tests by Australia. Graeme Smith, Hashim Amla, AB de Villiers and Faf du Plessis have formed a solid core for South Africa, while Michael Clarke has scored the bulk of the runs for Australia.
The battle for pace-bowling supremacy is a closely contested one, with little to differentiate the two teams, but what could separate the two teams is the batting, and in that aspect South Africa look more solid, even without Jacques Kallis. In the last three years, South Africa's overall batting average of 39.03 is well clear of the other teams. Australia are in second place, just like in the pace-bowling department, but their average of 33.33 is significantly below South Africa's, who have scored 36 centuries in 24 Tests, compared to 39 in 35 Tests by Australia. Graeme Smith, Hashim Amla, AB de Villiers and Faf du Plessis have formed a solid core for South Africa, while Michael Clarke has scored the bulk of the runs for Australia.
| Batsman | Tests | Runs | Average | 100s/ 50s |
| Michael Clarke | 34 | 3322 | 59.32 | 12/ 7 |
| AB de Villiers | 24 | 2125 | 62.50 | 6/ 11 |
| Hashim Amla | 23 | 2120 | 60.57 | 8/ 9 |
| David Warner | 27 | 1924 | 40.93 | 5/ 10 |
| Graeme Smith | 24 | 1798 | 47.31 | 5/ 9 |
| Alviro Petersen | 20 | 1296 | 40.50 | 4/ 4 |
| Brad Haddin | 23 | 1138 | 31.61 | 1/ 9 |
| Steven Smith | 13 | 905 | 41.13 | 3/ 4 |
| Chris Rogers | 10 | 830 | 43.68 | 3/ 5 |
| Faf du Plessis | 11 | 782 | 60.15 | 3/ 2 |
South Africa seem to have the more dependable batting line-up, but even they've had problems against Australia at home. Kallis averaged 41.22 in 29 Tests against Australia, but in 14 home Tests against them, he averaged only 33.62, with two centuries in 26 innings.
Among the batsmen in the current squad, Graeme Smith has had more problems against Australia at home than in Australia, with his average dropping by about five runs at home. Similarly, Amla's home average against Australia drops to 42.88 - which is still fairly healthy - from 51.10 in Australia.
Australia's best batsman has also had far more success against South Africa in home conditions: in six home Tests against them he averages 106.55; in five away Tests, he averages 34.11, though that also includes a fantastic 151 in Cape Town in 2011.
| Overall | in South Africa | |||||
| Batsman | Tests/ Runs | Average | 100s/ 50s | Tests/ Runs | Average | 100s/ 50s |
| AB de Villiers | 17/ 1300 | 46.62 | 4/ 8 | 8/ 629 | 48.38 | 2/ 4 |
| Graeme Smith | 17/ 1181 | 39.36 | 3/ 5 | 8/ 445 | 34.23 | 1/ 2 |
| Hashim Amla | 11/ 1022 | 51.10 | 4/ 4 | 5/ 386 | 42.88 | 2/ 1 |
| JP Duminy | 7/ 389 | 48.62 | 1/ 2 | 3/ 143 | 35.75 | 0/ 1 |
| Faf du Plessis | 2/ 293 | 146.50 | 1/ 2 | - | - | - |
| Alviro Petersen | 3/ 200 | 33.33 | 0/ 2 | - | - | - |
A venue for pace
To make matters worse for the batsmen, the first Test of the series will be played in Centurion, a venue which has been quite fast-bowler friendly in the last few years. Since the beginning of 2006, fast bowlers have averaged 28.88 here, and have taken 202 wickets at a strike rate of 50.7. Among venues which have hosted at least four Tests during this period, there are only five grounds where fast bowlers have a better average. On the other hand, spinners have averaged 44.65 here during this period, taking 38 wickets in eight Tests.
To make matters worse for the batsmen, the first Test of the series will be played in Centurion, a venue which has been quite fast-bowler friendly in the last few years. Since the beginning of 2006, fast bowlers have averaged 28.88 here, and have taken 202 wickets at a strike rate of 50.7. Among venues which have hosted at least four Tests during this period, there are only five grounds where fast bowlers have a better average. On the other hand, spinners have averaged 44.65 here during this period, taking 38 wickets in eight Tests.
The list of leading wicket-takers in Centurion is filled with fast bowlers, and most of them have superb averages. Steyn has 36 wickets from six Tests at 17.61, Morkel's 17 wickets here have come at 23.41, while Philander has 12 at an average of 13.66.
Among the leading run-scorers here, Amla (678 runs at 84.75) and de Villiers (866 runs at 61.85) have impressive stats, but South Africa will miss Kallis, who is the leading run-getter here with 1267 runs at 70.38.
And apart from all these stats is South Africa's daunting record in Centurion: in 18 Tests they've won 14 and lost one, against England in 2000, in a Test in which both teams forfeited an innings each. Since then, South Africa have won 11 and drawn two in 13 games. No team has such an imposing record at any venue in Test history: with a 12-Test cut-off, the next-best is Pakistan in Karachi, where they've won 21 and lost two. Since 1990, the next-best win-loss ratio by any team is South Africa's record in Cape Town - the venue of the third Test - where they've won 18 times and lost thrice.
Australia have played only once in Centurion - way back in 1997 - and lost by eight wickets. That, however, was a dead rubber, as Australia had already won the first two Tests of the three-match series. When play begins at Supersport Park on Wednesday, there'll be plenty at stake for both teams.
S Rajesh is stats editor of ESPNcricinfo. Follow him on Twitter