Home advantage in the IPL
A look at the teams who have been most dominant at their home venues, and others who've struggled at home
S Rajesh
20-May-2011
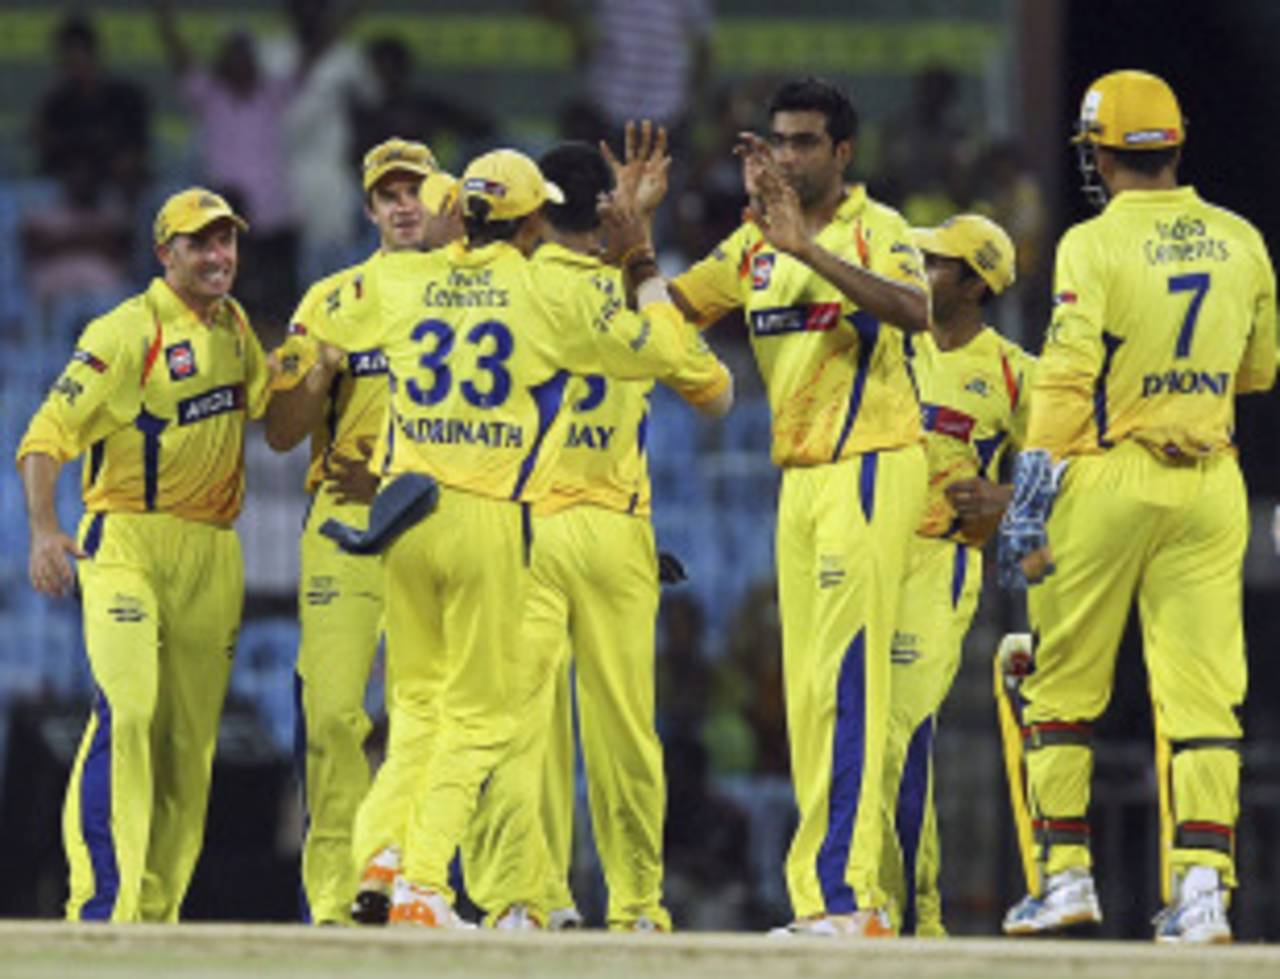
Chennai Super Kings lost four home games in the first season of the IPL, but this year they've won seven out of seven • Associated Press
Going into the final week of IPL 2011, Chennai Super Kings will like their chances of repeating their 2010 result and winning the tournament for the second year in a row. They've obviously been in superb form with both bat and ball, but equally importantly, the last two matches of the tournament will be held at the MA Chidambaram Stadium in Chennai, a ground where the home team have won each of their seven games this year. If they finish the round-robin stage among the top two, they'll be guaranteed at least one more game on home turf - if they lose the qualifier (the match between the top two sides), they'll play the winner of the eliminator match (between the third and fourth sides) in Chennai; and if they make it to the final, the venue of that match will again be Chennai.
A game at home is an advantage for most teams (unless the side are Deccan or Delhi), but for Chennai, in particular, it's been a huge factor in IPL 2011: they've been unbeaten in seven home matches this year, but they've lost four out of six away games. They were beaten in their first three away games, against Punjab, Kochi and Mumbai, but have won two of their last three, against Pune and Rajasthan. As the table below shows, the home and away batting stats aren't that different for Chennai, but the bowling numbers indicate why they are such a feared home team: they average 21.29 at an economy rate of 7.30 at home, but in away games those numbers go up to 35.76 and 7.98. R Ashwin has an impressive economy rate of 6.91 in away games, but at home he has been outstanding, giving away only 5.78 per over. The difference is much greater for Shadab Jakati: seven wickets at 23, at an economy rate of seven at home, and no wickets in five away games, at an economy rate of 8.88.
The two other teams who have especially relished home conditions are Punjab and Bangalore - both have lost only one home game so far. For Punjab, both their batting and bowling numbers are adversely affected when they leave Mohali or Dharamsala. Shaun Marsh has been consistent both home and away, but Adam Gilchrist has scored only 139 runs in seven away games at a strike rate of less than 110, compared to 193 runs at a strike rate of 147.32 in home games. For Bangalore, the difference in their bowling numbers is significant - the economy rate goes up from 6.90 to 8.77. S Aravind, for example, has six wickets in five away games at an economy rate of 9.05; at home he has eight wickets in four innings at a terrific average of 10.87 and economy rate of 5.80.
In all, six out of 10 teams have won more games than they have lost at home, and for five of them the win-loss ratio is two or more. On the other hand, only three teams have won more games than they have lost away. Mumbai Indians are clearly the most consistent, with an identical 4-2 win-loss record, but the only other side who've done as well in away games are Deccan, a team who have had another wretched home season. After losing all seven home games in IPL 2008, it seemed their luck might change when they beat Bangalore in their second home match in 2011, but thereafter they've lost five in a row at the Rajiv Gandhi International Stadium. Their home and away stats show that the bowlers have really struggled, and the problem has been for the spinners at home: Amit Mishra's home economy rate is 8.05, and his away rate is 5.95, while for Pragyan Ojha the corresponding numbers are 7.95 (home) and 6.52 (away).
| Team | Home games | Won/ lost | Bat ave/ Run-rate | Bowl ave/ ER | Away games | Won/ lost | Bat ave/ Run-rate | Bowl ave/ ER |
| Chennai Super Kings | 7 | 7/ 0 | 36.12/ 8.07 | 21.29/ 7.30 | 6 | 2/ 4 | 35.76/ 7.98 | 28.51/ 7.97 |
| Kings XI Punjab | 6 | 5/ 1 | 30.62/ 8.99 | 18.27/ 7.51 | 7 | 2/ 5 | 24.09/ 7.58 | 33.45/ 8.97 |
| Kolkata Knight Riders | 6 | 4/ 2 | 30.25/ 7.17 | 21.52/ 6.82 | 6 | 3/ 3 | 28.53/ 7.67 | 25.08/ 7.58 |
| Mumbai Indians | 6 | 4/ 2 | 35.84/ 7.76 | 19.44/ 7.53 | 6 | 4/ 2 | 23.59/ 6.97 | 19.17/ 6.62 |
| Rajasthan Royals | 7 | 4/ 3 | 28.48/ 7.24 | 27.88/ 7.40 | 5 | 1/ 4 | 17.51/ 6.61 | 31.61/ 8.31 |
| Royal Challengers Bangalore | 5 | 4/ 1 | 34.50/ 8.85 | 22.57/ 6.90 | 7 | 4/ 3 | 27.53/ 8.24 | 36.11/ 8.77 |
| Kochi Tuskers Kerala | 7 | 3/ 4 | 21.92/ 7.82 | 23.16/ 7.48 | 7 | 3/ 4 | 22.27/ 7.31 | 31.93/ 7.84 |
| Pune Warriors | 6 | 2/ 4 | 24.08/ 7.74 | 24.80/ 7.55 | 6 | 2/ 4 | 19.75/ 7.00 | 24.88/ 7.07 |
| Delhi Daredevils | 6 | 1/ 5 | 21.64/ 7.72 | 31.68/ 8.25 | 7 | 3/ 4 | 22.44/ 8.12 | 30.44/ 8.42 |
| Deccan Chargers | 7 | 1/ 6 | 22.33/ 7.65 | 35.67/ 8.26 | 6 | 4/ 2 | 23.51/ 7.29 | 18.95/ 6.99 |
Across the three years that the IPL has been played in India, home teams have had a slight overall advantage, winning 95 matches and losing 80, which converts into a ratio of 1.19. This year home teams have had it slightly better, despite teams like Deccan and Delhi, winning five out of every nine. It's the highest winning ratio for home teams in all three seasons of the IPL.
| Season | Matches | Home team won | Home team lost | Ratio |
| 2008 | 55 | 29 | 26 | 1.12 |
| 2010 | 57 | 31 | 26 | 1.19 |
| 2011 | 63 | 35 | 28 | 1.25 |
| Overall | 175 | 95 | 80 | 1.19 |
The win-loss ratios for the home team at each venue ranges from 2.40 at the Sawai Mansingh Stadium in Jaipur to a shocking 0.07 in Uppal. Rajasthan's captain had plenty to say about pitch preparation on their home turf, and not without reason: they had a superb record in home games in the first half of this tournament, winning four out of five, before losing the last two after much controversy about the nature of the track. Despite those two losses, Rajasthan's home win record remains the best, though they haven't always been as difficult to beat in away games.
The second-most formidable team at home are Chennai, with 14 wins and six defeats, a record that has obviously been bolstered by their spotless display this season. It's a huge improvement on their record in the first season, when they lost four and won three. Eden Gardens has been a fine venue for Kolkata too, which is a good thing for them since they'll be playing the last round-robin game of the tournament there against Mumbai. The DY Patil ground is a unique one as it has played host to two teams in two seasons, but Pune Warriors didn't enjoy much success there, winning only two of their first six games.
Of the nine venues that have hosted 10 or more home games, five have a win-loss ratio of more than one. The Chinnaswamy Stadium has been a bit of a disappointment for Bangalore, though, with only nine wins in 19 games. The stats for the Feroz Shah Kotla have been adversely affected by Delhi's home results this season - one win and five defeats - but that's still nothing compared to how badly the Rajiv Gandhi Stadium has treated the Deccan Chargers.
| Venue | Matches | Home team wins | Home team losses | Ratio |
| Sawai Mansingh Stadium, Jaipur | 17 | 12 | 5 | 2.40 |
| MA Chidambaram Stadium, Chennai | 21 | 14 | 6 | 2.33 |
| Eden Gardens, Kolkata | 20 | 13 | 7 | 1.85 |
| Punjab CA Stadium, Mohali | 16 | 10 | 6 | 1.67 |
| Wankhede Stadium, Mumbai | 10 | 6 | 4 | 1.50 |
| Dr DY Patil Stadium, Mumbai | 12 | 6 | 6 | 1.00 |
| M Chinnaswamy Stadium, Bangalore | 19 | 9 | 10 | 0.90 |
| Feroz Shah Kotla, Delhi | 19 | 8 | 11 | 0.72 |
| Rajiv Gandhi International Stadium, Uppal | 14 | 1 | 13 | 0.07 |
All stats updated till the 64th match of IPL 2011.
S Rajesh is stats editor of Cricinfo