Little to choose between Australia and Sri Lanka
Australia and Sri Lanka, who fought out a closely contested best-of-three finals, were streets ahead of India on the batting and bowling fronts
Madhusudhan Ramakrishnan
09-Mar-2012
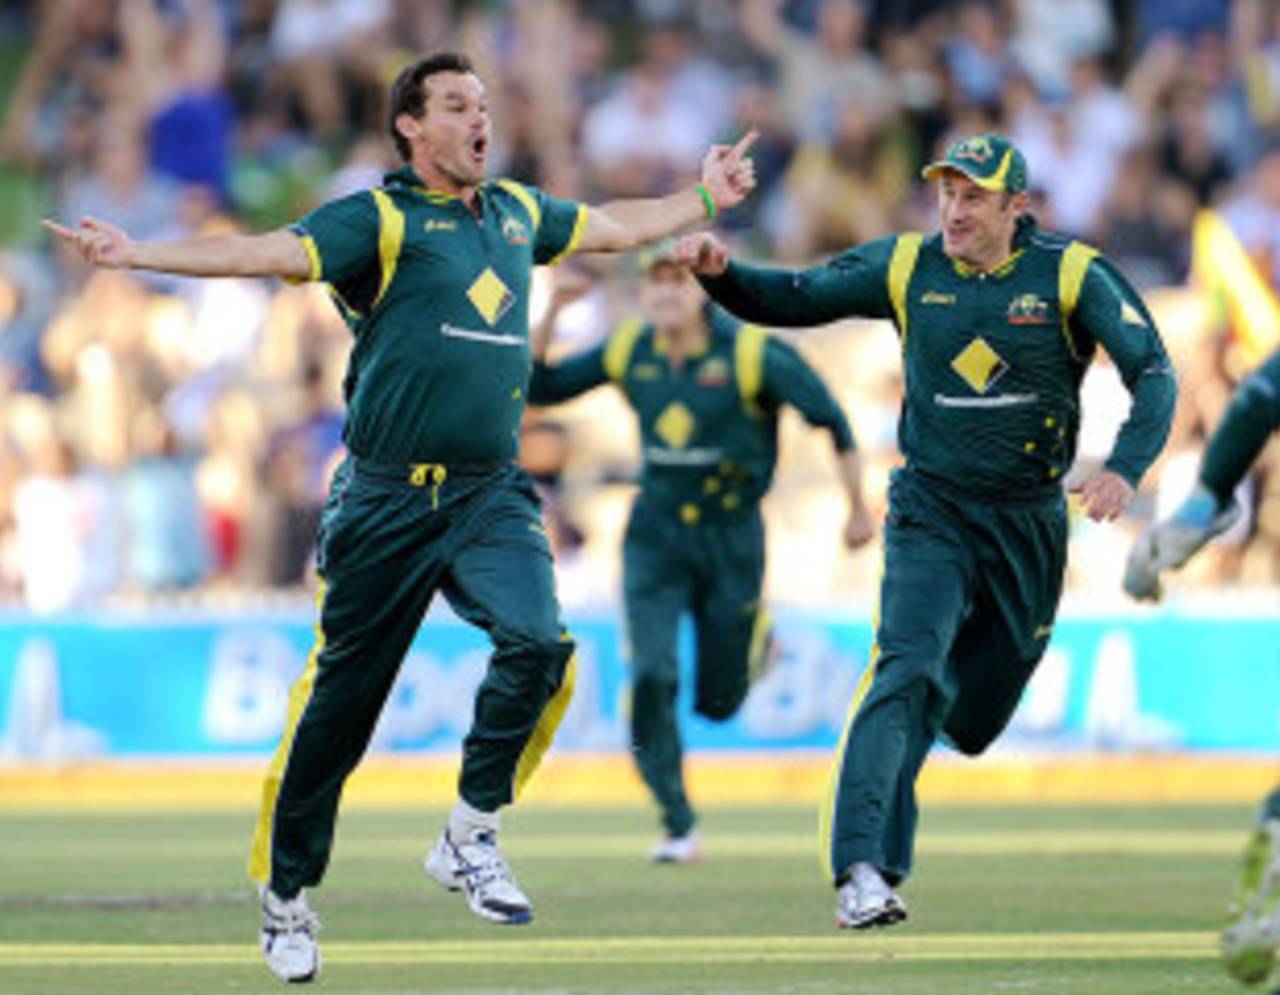
Clint Mckay, who finished with 15 wickets at 19.40, was the stand-out bowler in a tournament where almost all bowlers struggled for impact • AFP
At the end of a long and gruelling summer, Australia, faced with multiple injury problems, appeared jaded as the CB Series went on. However, as has usually been the case, they were able to pick themselves up for the crucial contest and managed to put it past a spirited Sri Lankan team in the finals. Despite losing to Sri Lanka in four out of six matches before the third final, Australia produced an impressive bowling performance to defend a modest target of 232. Sri Lanka, who had also reached the finals in 2005-06, were a far improved team this time around. They twice beat Australia comprehensively, and were unlucky to lose three games by narrow margins and tie another against India earlier in the tournament.Their batsmen were by far the best among the three teams. India, on the other hand, were highly inconsistent and their run of big losses against Australia left them with too much to do in the end to qualify for the final.
Throughout the tournament, Sri Lanka proved to be the best batting team and their top order was the most consistent. Even on the occasions when the top order failed to perform, the middle-order batsmen were up for the challenge. In the first final, faced with a massive target of 322, Sri Lanka collapsed to 144 for 6 before staging a remarkable recovery to reach 306. On the other hand, India's batting was very ordinary throughout the series except for their final game when they completed an extraordinary chase of 321 in just 36.4 overs. Their batting display against Australia, however, was well below par and they ended up conceding a bonus point on three occasions in four matches against them. The average difference (difference between batting and bowling averages) and run-rate difference (difference between run-rate and economy rate) are clear indicators of the gulf between the finalists and India. While Australia have an average difference of 4.05 an run-rate difference of 0.13, the corresponding figures for Sri Lanka are 3.56 and 0.06. India, however, are way behind Australia and Sri Lanka, with corresponding values of -10.93 and -0.24 respectively.
| Team | Matches | Wins/Losses | Bat avg | Bowl avg | Avg diff | RR | ER | RR diff |
| Australia | 11 | 6/5 | 32.30 | 28.25 | 4.05 | 5.27 | 5.14 | 0.13 |
| Sri Lanka | 11 | 5/5 | 35.53 | 31.97 | 3.56 | 5.37 | 5.31 | 0.06 |
| India | 8 | 3/4 | 28.01 | 38.94 | -10.93 | 5.26 | 5.50 | -0.24 |
In the end, Australia ended with a 6-5 win-loss record in the tournament after the triumph in the third final. Sri Lanka though, were marginally behind, finishing with an even win-loss record (5-5) with one tied game. However, Sri Lanka were the better team in clashes against Australia, winning three of the four group matches and one more in the finals. They had an average difference of 6.06 and run-rate difference of 0.44 in the group stages against Australia. India, who finished with a 2-1 record against Sri Lanka, had an inferior batting average (36.75 to 39.92) but a positive run-rate difference of 0.37 by virtue of the superb chase in their final group game. The Australia-India contests were, however, extremely one-sided. Following their dominance of India in the Test series when they won 4-0, Australia extended their hold in the tri-series by winning three of the four matches while gaining a bonus point on each occasion. The extent of Australia's domination is reflected in the high value of the average difference (16.74) and run-rate difference (0.97). In the best-of-three finals, Australia and Sri Lanka were closely matched across the three games with Australia finishing with the higher batting average and Sri Lanka ending with a slightly higher run-rate.
| Opponents | Matches | Wins/Losses | Bat avg (T1)/Bat avg (T2)* | Avg diff | RR (T1) /RR (T2) | RR diff |
| Australia-Sri Lanka (group games) | 4 | 1/3 | 24.94/31.00 | -6.06 | 4.74/5.18 | -0.44 |
| India-Sri Lanka | 4 | 2/1 | 36.75/39.92 | -3.17 | 5.76/5.39 | 0.37 |
| Australia-India | 4 | 3/1 | 37.96/21.22 | 16.74 | 5.63/4.70 | 0.93 |
| Australia- Sri Lanka (finals) | 3 | 2/1 | 37.40/36.13 | 1.27 | 5.50/5.57 | -0.07 |
The biggest reason for Sri Lanka's success in the tri-series was the excellent form of their top-order batsmen. Tillakaratne Dilshan, the highest run-getter in the series with 513, was consistent throughout and scored centuries against India and Australia. Both Mahela Jayawardene and Kumar Sangakkara, Sri Lanka's most experienced batsmen, were also in great touch and ended with more than 400 runs. With the exception of David Warner, who became the first batsman to score two centuries in the finals, Australia's top-order batsmen were surprisingly inconsistent in home conditions. And in a tournament where India's batting hardly had an impact, Virat Kohli and Gautam Gambhir stood out. All three teams were evenly matched when it came to the performance of the middle-order (Nos.4-7) batsmen. David Hussey, in particular, was outstanding throughout and scored five half-centuries. Sri Lanka were slightly ahead of the fray in the lower-order batting stats with timely contributions from Nuwan Kulasekara and Lahiru Thirimanne.
| Bat position | Australia (avg, 100/50) | India (avg, 100/50) | Sri Lanka (avg, 100/50) |
| 1-3 | 32.21, 3/4 | 27.87, 0/4 | 42.30, 3/6 |
| 4-7 | 36.75, 1/11 | 33.36, 1/3 | 33.40, 0/9 |
| 8-11 | 13.26, 0/0 | 12.33, 0/0 | 17.31, 0/1 |
A comparison of the teams' performances across the Powerplay overs reveals some interesting numbers. In the mandatory Powerplay (overs 1-10), Sri Lanka and India were ahead of the hosts, losing fewer wickets and scoring at a higher rate. In the bowling Powerplay, however, Australia scored at a higher run-rate but averaged lesser than Sri Lanka. In the same period, India had a slightly higher scoring rate than Sri Lanka, but averaged less than 30. All three teams finished with fairly even run-rates in the batting Powerplay. The hosts, however, were far ahead on the average front finishing with an average of 80.00 while India and Sri Lanka ended with averages of 32.42 and 27.00 respectively.
| Phase of innings | Australia (Runs/wickets, RR) | India (Runs/wickets, RR) | Sri Lanka (Runs/wickets, RR) |
| Mandatory Powerplay (overs 1-10) | 505/16, 4.59 | 410/14, 5.32 | 558/13, 5.16 |
| Bowling Powerplay | 268/6, 5.36 | 178/6, 4.68 | 223/4, 4.46 |
| Batting Powerplay | 320/4, 6.66 | 227/7, 6.64 | 352/13, 6.49 |
Given the success of the top-order batsmen, Sri Lanka's dominance of the partnership stats is not surprising. They averaged nearly fifty for the top three partnerships and were involved in three century stands including the highest of the tournament (200 between Dilshan and Sangakkara against India). In contrast, both Australia and India struggled to stitch solid partnerships for the first two wickets but almost finished on par with Sri Lanka for the third wicket. Australia had the most consistent middle order and their partnership averages for wickets 4-6 were the best among the three teams. They also finished with 11 fifty-plus stands, the highest among the three teams (Sri Lanka and India had four each).
| Partnership wicket | Australia (avg, 100/50 stands) | India (avg, 100/50 stands) | Sri Lanka (avg, 100/50 stands) |
| 1 | 36.45, 1/2 | 21.00, 0/2 | 49.72, 1/3 |
| 2 | 22.27, 0/1 | 32.37, 0/1 | 49.27, 1/4 |
| 3 | 48.54, 2/0 | 46.12, 1/2 | 49.44, 1/2 |
| 4 | 45.72, 1/4 | 44.00, 1/1 | 43.00, 0/3 |
| 5 | 36.90, 0/3 | 31.57, 0/2 | 26.75, 0/1 |
| 6 | 32.44, 0/3 | 20.14, 0/0 | 15.00, 0/0 |
| 7 | 19.50, 0/0 | 36.20, 0/1 | 32.85, 1/0 |
In the first few matches of the tournament, there were very few high scores and the bowlers had a significant impact. However, in the latter stages of the tournament, the batsmen dominated the proceedings and there were four 300-plus scores in the last five matches. Even the experienced Lasith Malinga and Brett Lee proved expensive in most matches with Malinga conceding over nine runs per over on two occasions. Malinga ended the series with an economy rate of 6.21, his highest for a series of four or more matches. Clint Mckay, who was man of the match in the third final for his 5 for 28, was by far the best pace bowler in the tournament finishing with 15 wickets at an average of 19.40 and economy rate of 4.60. Overall, Australian pace bowlers finished with the most wickets and had the best stats among the fast bowlers from the three teams. The spinners were quite effective in curbing the run-rate but were hardly among the wickets. Not only did the pace bowlers disappoint for India, the spinners were also below par and finished with 17 wickets at an economy rate of 5.31 and a high average of 44.65.
| Bowler type | Australia (wickets, avg, ER) | India (wickets, avg, ER) | Sri Lanka (wickets, avg, ER) |
| Pace | 69, 26.40, 5.13 | 28, 35.58, 5.65 | 61, 29.93, 5.62 |
| Spin | 14, 41.00, 4.64 | 17, 44.65, 5.31 | 12, 42.50, 4.44 |
In the first ten-over period of the innings, India's pace bowlers were the most economical (economy rate of 4.27) while the pace bowlers from the other two teams finished with corresponding numbers greater than five. In the middle overs (11-40), the Australian pace bowlers finished with the best average (29.17) and economy rate (5.01) while the Indian fast bowlers had the worst numbers (average of 45.18 and economy rate of 5.58). David Hussey and Xavier Doherty bowled consistent lines in the middle overs and ensured that Australia's spin-bowling stats in the period were highly competitive. In the final ten-over phase (overs 41-50), the Australian and Sri Lankan fast bowlers finished with much better averages and economy rates than their Indian counterparts. In the end overs, the Indian spinners outperformed the Australian spinners, but finished with a higher average and economy rate than the Sri Lankan spinners.
| Bowler type | Overs | Australia (avg, ER) | India (avg, ER) | Sri Lanka (avg, ER) |
| Pace | 1-10 | 31.38, 5.38 | 38.00, 4.27 | 35.73, 5.25 |
| Spin | 1-10 | -, 6.60 | - | 32.00, 4.00 |
| Pace | 11-40 | 29.17, 5.01 | 45.18, 5.58 | 37.37, 5.49 |
| Spin | 11-40 | 42.18, 4.39 | 57.84, 5.25 | 58.62, 4.30 |
| Pace | 41-50 | 16.15, 6.23 | 26.50, 8.24 | 16.92, 6.66 |
| Spin | 41-50 | 20.25, 6.23 | 20.14, 5.64 | 18.80, 5.52 |