South Africa's Sri Lanka-phobia
Since 2000, South Africa have a 1-12 win-loss record versus Sri Lanka in Sri Lanka; no team other than Bangladesh have done as badly
S Rajesh
02-Aug-2013
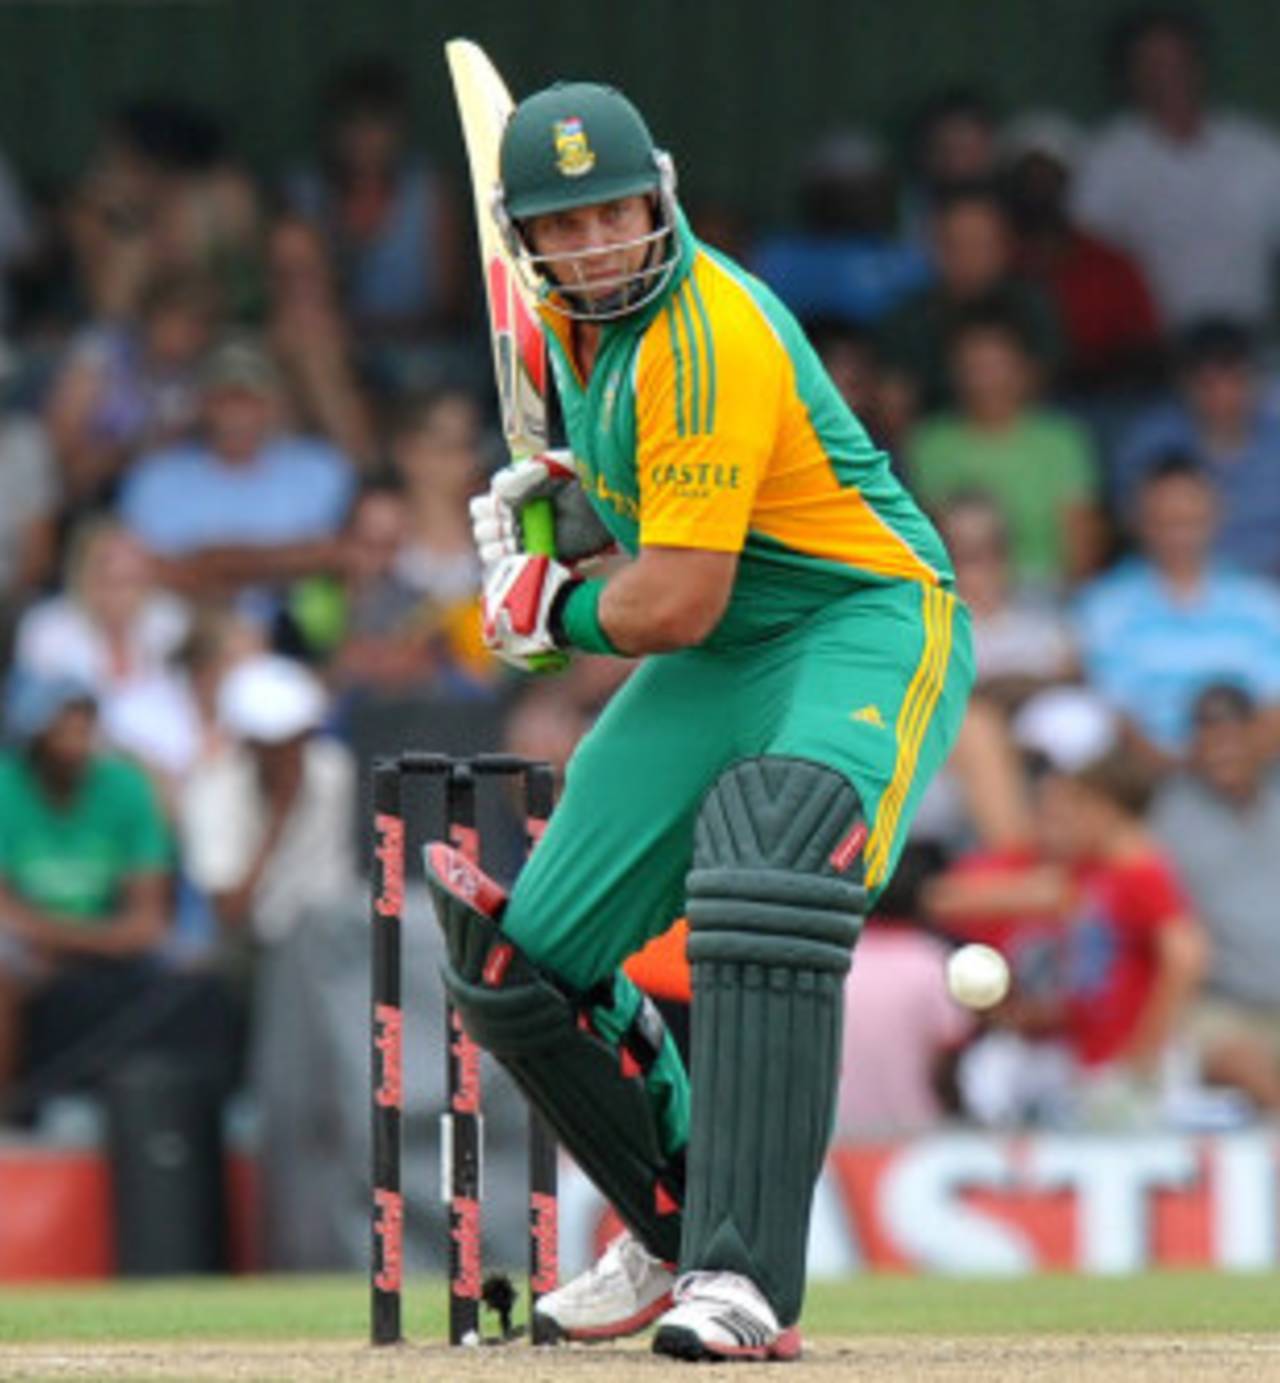
In 16 ODIs that South Africa have played against Sri Lanka in Sri Lanka, they've managed only one century - 101 by Jacques Kallis in 2004 • AFP
South Africa are the best Test side in the world by some distance, but their ODI fortunes haven't been as favourable recently. In 2013, they've won only seven out of 18 ODIs, and their win-loss ratio of 0.70 is seventh out of nine teams who've played at least ten ODIs this year - only West Indies and Zimbabwe have done worse. South Africa are currently ranked fifth in ODIs, but they didn't even play like the fifth-best team in the recently concluded series against Sri Lanka, who are only ranked one place above them.
As much as the 4-1 series verdict, it was the margin of defeat in most of those matches which would have disappointed South African supporters. Two of them were among their heaviest in terms of runs - the 180-run loss at the Premadasa Stadium is their second-largest margin of defeat, while the 128-run margin at the same ground is the seventh-biggest. It wasn't much better when they batted first either, as they lost in Pallekele by eight wickets with 36 balls to spare. Admittedly, South Africa were missing Dale Steyn and Jacques Kallis, and weren't helped by Hashim Amla's injury, but even so the gulf between the two sides was surprisingly huge.
These defeats continued South Africa's shocking run against Sri Lanka in Sri Lanka: in 16 ODIs they've won two and lost 13; since 2000, that record is even more appalling - one win and 12 defeats in 13 matches. It's easily their worst record against a team on their home turf; England is the next-poorest, where they've won three and lost ten. In Sri Lanka, no team has done worse against them since 2000: the only team to have done as badly is Bangladesh. Against other teams in Sri Lanka, though, South Africa haven't done badly, winning four out of five, including two against Pakistan.
For a team which boasts such quality in both batting and bowling, their stats in Sri Lanka are pretty mediocre - with the bat they've averaged less than 23 per dismissal, and with the ball they've conceded more than 40 per wicket. Most of the other teams from outside the subcontinent have done much better: Australia, in fact, have the best win percentage among all teams, while England have won three in ten and West Indies two in eight. The only team other than Australia to have won more than they've lost is India, with 17 wins and 15 defeats. (They've also played, by far, the most matches against Sri Lanka in Sri Lanka.)
| Team | Matches | Won/ lost | Ratio | Bat ave | Run rate | Bowl ave | Econ rate |
| Australia | 12 | 6/ 5 | 1.20 | 31.24 | 4.65 | 24.82 | 4.46 |
| India | 35 | 17/ 15 | 1.13 | 30.26 | 4.96 | 30.77 | 5.05 |
| Pakistan | 21 | 7/ 12 | 0.58 | 25.77 | 4.45 | 27.78 | 4.50 |
| England | 10 | 3/ 7 | 0.42 | 19.17 | 3.68 | 32.98 | 4.56 |
| West Indies | 8 | 2/ 5 | 0.40 | 27.46 | 4.63 | 34.10 | 4.91 |
| New Zealand | 13 | 1/ 10 | 0.10 | 20.71 | 4.08 | 31.69 | 4.59 |
| South Africa | 13 | 1/ 12 | 0.08 | 22.65 | 4.49 | 40.26 | 5.24 |
| Bangladesh | 14 | 1/ 12 | 0.08 | 19.55 | 4.11 | 42.98 | 5.46 |
South Africa's numbers against Sri Lanka in Sri Lanka are also surprising because they haven't done so badly against other teams in the subcontinent. Against India they have a respectable 6-7 record in 13 games, while against Pakistan they have a 10-8 advantage (6-4 in Pakistan and 4-4 in the UAE).
As the table below shows, the difference between South Africa's stats in India and Sri Lanka is largely their batting. In India they've averaged more than 41, and scored at almost five-and-a-half per over; in Sri Lanka the average drops by almost half, and the scoring rate by about a run per over.
| Against | Matches | Won/ lost | Ratio | Bat ave | Econ rate | Bowl ave | Econ rate |
| Bangladesh | 6 | 6/ 0 | - | 58.47 | 4.99 | 15.85 | 3.57 |
| Pakistan | 18 | 10/ 8 | 1.25 | 34.06 | 4.99 | 27.14 | 4.74 |
| India | 13 | 6/ 7 | 0.85 | 41.39 | 5.45 | 36.29 | 5.58 |
| Sri Lanka | 13 | 1/ 12 | 0.08 | 22.65 | 4.49 | 40.26 | 5.24 |
Breaking up the numbers further into South Africa's batting stats against pace and spin in Asia, it's clear that while they've struggled against both in Sri Lanka, they've played spin much worse there than in any other country. Pakistan have a pretty potent spin attack too, but against them, in Pakistan and in the UAE, South Africa's batsmen have averaged 45.39 runs per dismissal; in Sri Lanka, it drops to half that number. Only Bangladesh and New Zealand have poorer averages against spin in Sri Lanka. Against pace, though, South Africa's average of 28.84 is among the better ones - only India and West Indies have averaged more.
| Team | Pace-wkts | Average | Econ rate | Spin-wkts | Average | Econ rate |
| Sri Lanka | 33 | 28.84 | 4.81 | 73 | 22.43 | 4.17 |
| Pakistan | 71 | 31.94 | 5.09 | 38 | 45.39 | 4.55 |
| India | 30 | 53.90 | 6.12 | 46 | 37.76 | 4.81 |
| Bangladesh | 6 | 90.00 | 5.74 | 15 | 51.40 | 4.40 |
| Opposition | Spinners-wkts | Average | Econ rate | Seamers-wkts | Average | Econ rate |
| Bangladesh | 43 | 21.86 | 3.88 | 64 | 19.68 | 4.00 |
| New Zealand | 41 | 22.02 | 3.64 | 42 | 22.61 | 4.16 |
| South Africa | 73 | 22.43 | 4.17 | 33 | 28.84 | 4.81 |
| England | 30 | 24.56 | 3.50 | 51 | 17.05 | 3.66 |
| West Indies | 34 | 29.32 | 4.59 | 22 | 34.59 | 4.37 |
| Pakistan | 53 | 29.75 | 4.25 | 89 | 28.28 | 4.39 |
| India | 77 | 37.00 | 4.55 | 143 | 30.43 | 5.05 |
| Australia | 35 | 41.14 | 4.42 | 30 | 26.03 | 4.74 |
Four of Sri Lanka's most successful spinners at home against South Africa during this period have been Upul Chandana, Tillakaratne Dilshan, Ajantha Mendis and Rangana Herath. Against the other top teams at home, these four spinners have had modest success, with only Mendis averaging less than 35.
| Against South Africa | Against other teams* | |||||
| Bowler | Wickets | Average | Econ rate | Wickets | Average | Econ rate |
| Upul Chandana | 16 | 18.31 | 4.56 | 19 | 38.42 | 4.57 |
| Tillakaratne Dilshan | 14 | 25.71 | 4.63 | 14 | 56.35 | 4.92 |
| Ajantha Mendis | 10 | 12.20 | 4.25 | 36 | 26.05 | 4.47 |
| Rangana Herath | 9 | 19.55 | 3.60 | 14 | 43.78 | 4.39 |
Not surprisingly, the stats for South Africa's batsmen in Sri Lanka make for sorry reading, and also indicates how much they missed Kallis. He is the only one to have scored a century there against Sri Lanka during this period, and has topped 50 four times in eight innings. Most of the others - from Herschelle Gibbs and Graeme Smith to AB de Villiers and Jacques Rudolph - haven't solved the mystery of scoring ODI runs in Sri Lanka.
| Batsman | Innings | Runs | Average | Strike rate | 100s/ 50s |
| Jacques Kallis | 8 | 335 | 47.85 | 63.20 | 1/ 3 |
| JP Duminy | 10 | 194 | 19.40 | 70.80 | 0/ 1 |
| Graeme Smith | 5 | 139 | 27.80 | 68.81 | 0/ 0 |
| Gary Kirsten | 3 | 138 | 46.00 | 72.63 | 0/ 2 |
| AB de Villiers | 5 | 137 | 27.40 | 81.54 | 0/ 1 |
| David Miller | 5 | 122 | 40.67 | 91.72 | 0/ 1 |
| Jacques Rudolph | 5 | 116 | 23.20 | 69.87 | 0/ 0 |
| Hashim Amla | 2 | 95 | 47.50 | 95.95 | 0/ 1 |
| Herschelle Gibbs | 5 | 89 | 17.80 | 59.73 | 0/ 0 |
With their batsmen faring so badly in Sri Lanka, South Africa's only hope would be for their bowlers to lift their game and cover for the batting deficiencies, but that hasn't happened either. As the table below shows, South Africa's spinners have been completely ineffective, averaging 63.80 runs per wicket, while the fast bowlers have averaged almost 39 and conceded more than five per over. That's similar to their bowling stats in India, but there the batsmen have been prolific, allowing the bowlers to get away with those numbers. With the batting being significantly less effective in Sri Lanka, South Africa's results have nosedived, placing them on par with Bangladesh. It's a comparison they won't particularly enjoy.
| Opposition | Pace-wkts | Average | Econ rate | Spin-wkts | Average | Econ rate |
| Bangladesh | 40 | 12.70 | 3.23 | 16 | 26.50 | 3.89 |
| Pakistan | 118 | 28.00 | 4.62 | 18 | 43.50 | 4.70 |
| India | 65 | 36.41 | 5.41 | 16 | 63.12 | 5.62 |
| Sri Lanka | 55 | 38.84 | 5.14 | 15 | 63.80 | 4.97 |
S Rajesh is stats editor of ESPNcricinfo. Follow him on Twitter