Previous
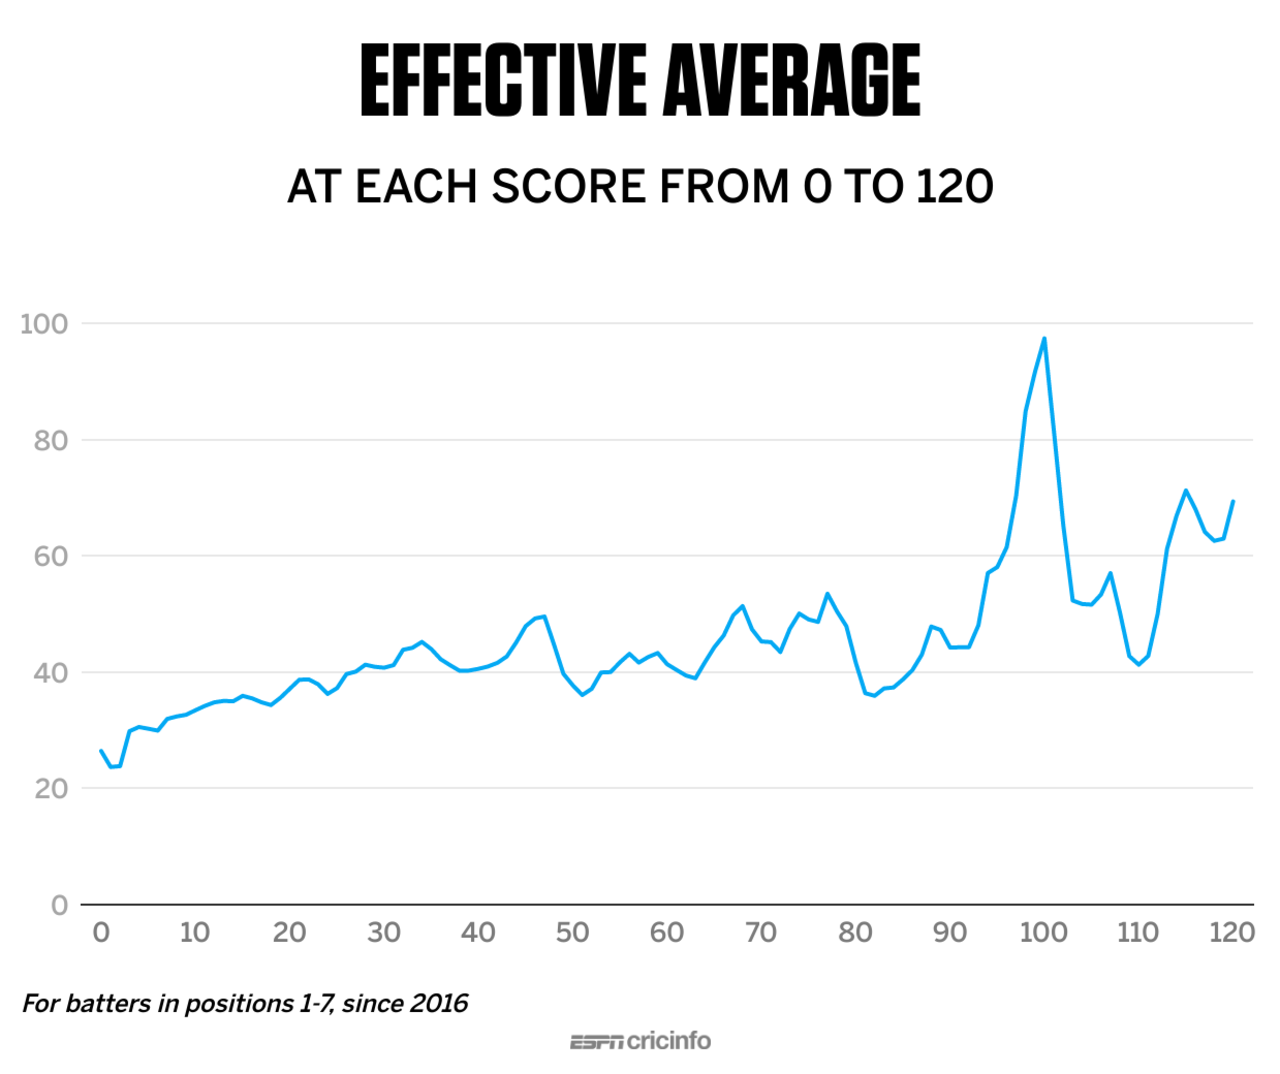
Line graph: effective average at every score from 1 to 120 in Tests, for Nos. 1-7 batters, since 2016
© ESPNcricinfo Ltd
Next