Imran Tahir: the ODI wicket-taking force
A look at the legspinner's limited-overs impact for South Africa, and the lack of huge totals in the West Indies
S Rajesh
17-Jun-2016
Of the 105 ODI wickets Imran Tahir has taken in his career, 77 have come between the 11th and 40th overs, at a strike rate of 33 balls per wicket • ESPNcricinfo Ltd
Before June 15, 2016, Imran Tahir hadn't had the greatest of ODI runs in the last nine months. In his last two series, against India and England, his performances had been underwhelming. He took 15 wickets in ten games at an average of 36.66 and an economy rate of 5.85. While those weren't terrible numbers, they weren't good enough for a bowler who had a career average of less than 22 and an economy rate of 4.4 going into that series against India.
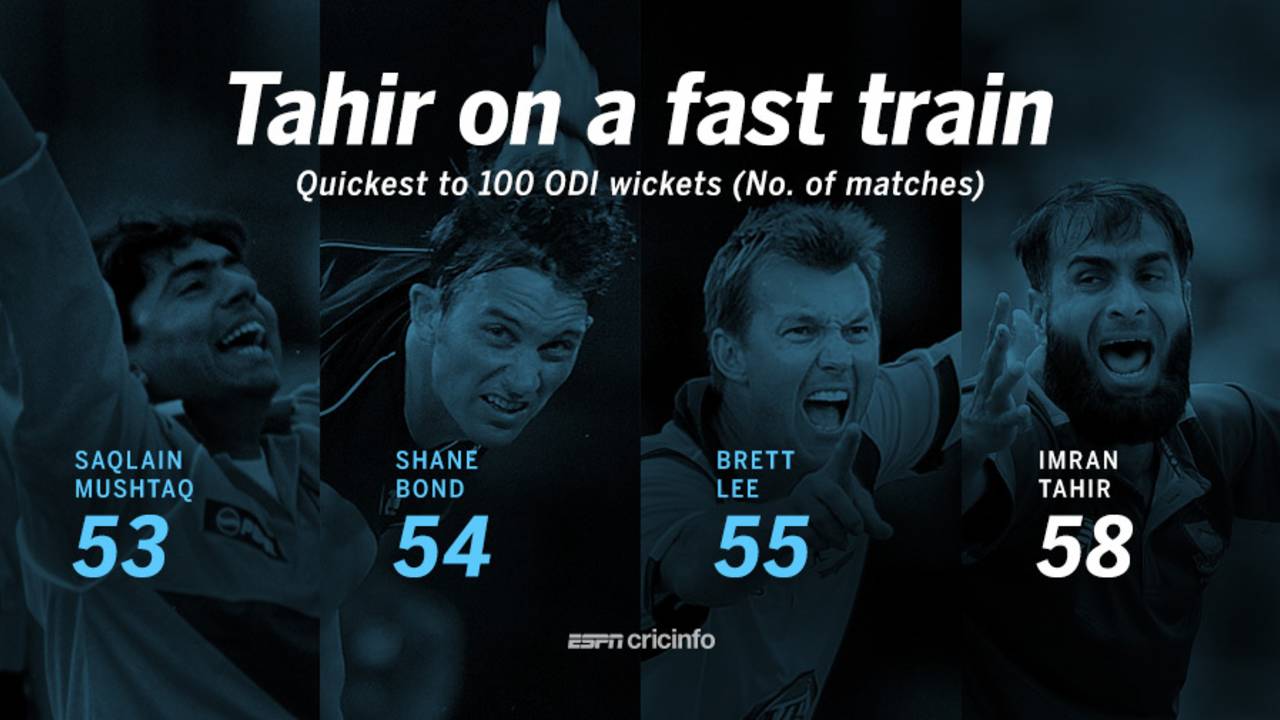
As it transpired, those few below-average games were only the proverbial lull before Tahir's wicket-taking storm hit West Indies' batsmen in Basseterre: his 7 for 45 were the third-best figures by a spinner in ODIs, and it propelled him to 100 wickets in the format in 58 matches - the fourth-fastest ever, after Saqlain Mushtaq, Shane Bond and Brett Lee.
About 15 months ago, Tahir had taken 5 for 45 against the same opposition in a World Cup game in Sydney, after South Africa had amassed 408. This time, after another huge performance by the batsmen, he went two wickets better.
As a wicket-taking force in ODIs over the last five years, there haven't been many bowlers who have matched his rate over the last five years. His strike rate of 29.2 is second among the 31 bowlers who have bowled at least 400 overs during this period. Only Morne Morkel has done better. In terms of averages, only Saeed Ajmal (20.27) has done better than Tahir's 22.75.
| Player | Mat | Overs | Wickets | Average | ER | SR |
| Morne Morkel | 73 | 604.1 | 127 | 23.29 | 4.89 | 28.5 |
| Imran Tahir | 58 | 512.3 | 105 | 22.75 | 4.66 | 29.2 |
| Saeed Ajmal | 78 | 697.0 | 140 | 20.27 | 4.07 | 29.8 |
| Lasith Malinga | 116 | 928.3 | 183 | 27.77 | 5.47 | 30.4 |
| Mitchell Johnson | 68 | 560.0 | 110 | 23.80 | 4.67 | 30.5 |
| Dale Steyn | 69 | 580.3 | 114 | 23.11 | 4.53 | 30.5 |
Tahir's huge impact for South Africa has been in the middle overs in ODIs. Of the seven-wicket haul in St Kitts, six came between the 11th and 40th overs. In his entire career, 77 out of 105 wickets have come in these middle overs, at an average of under 25 and a strike rate of 33 balls per wicket. Among bowlers who have bowled at least 300 overs between the 11th and 40th, only Mitchell Johnson and Morkel have marginally better strike rates. The wickets in the middle overs have helped South Africa put the brakes on opposition scoring rates in the last ten overs as well. In the 36 ODIs that South Africa have won with him in the side, Tahir has taken 81 wickets at an average of 18.30 and a strike rate of 23.9; in losses the average and strike rate both double. That's a pretty good illustration of just important Tahir has become to South Africa's ODI bowling attack.
| Bowler | Overs | ER | Wickets | Average | SR |
| Mitchell Johnson | 303.3 | 4.43 | 57 | 23.59 | 31.9 |
| Morne Morkel | 326.2 | 4.61 | 59 | 25.50 | 33.2 |
| Imran Tahir | 427.4 | 4.45 | 77 | 24.72 | 33.3 |
| Saeed Ajmal | 509.5 | 3.66 | 86 | 21.69 | 35.5 |
| Shakib Al Hasan | 341.5 | 4.03 | 50 | 27.62 | 41.0 |
| Sunil Narine | 396.2 | 3.99 | 54 | 29.31 | 44.0 |
Scoring rates in the West Indies
The two venues that have hosted matches so far in the West Indies Tri-Nation Series have witnessed contrasting matches. In Providence, the bowlers dominated and the batsmen struggled to put runs on the board. Teams batting first lost at least nine wickets, and were bowled out twice in three games. None of the teams topped 200, and the highest total was West Indies' 191 for 6 in 48.1 overs. The average run rate in the three games there was 3.97.
In St Kitts, the scoring patterns changed completely, with teams passing 250 five times in six innings. That included South Africa's mammoth 343 for 4 in the last game there, the 10th highest ODI total in the West Indies, and only the 11th instance of teams passing 300 there in ODIs since the start of 2010.
These two venues are at the two ends of the run-scoring spectrum in the West Indies, but overall, ODIs in that region have been pretty low-scoring for a while now. Since the beginning of 2007, the overall run rate in ODIs in the West Indies, before the most recent three games in St Kitts, was only 4.79, easily the poorest among all countries. The next lowest, among those that hosted at least 40 games during this period, is the UAE at 4.92, while Zimbabwe and Bangladesh also have a rate of less than five, partly because of the quality of the teams that have played there.
A comparison with India, New Zealand, Australia, South Africa and England indicates how different the ODIs in the West Indies have been in the last few years. In all these countries, the average run rates have been at least 5.40, and teams have topped 300 once every four to seven innings.
| Host Country | Mat | Ave | Run rate | Inngs per 300+ | Balls/boundary |
| West Indies | 57 | 28.25 | 4.79 | 11.40 | 13.46 |
| UAE | 68 | 29.47 | 4.92 | 22.33 | 12.76 |
| Zimbabwe | 63 | 32.54 | 4.95 | 15.75 | 12.91 |
| Bangladesh | 84 | 29.94 | 4.99 | 13.92 | 11.85 |
| Sri Lanka | 80 | 30.71 | 5.23 | 9.06 | 11.59 |
| Australia | 94 | 31.80 | 5.40 | 4.68 | 11.70 |
| England | 75 | 31.85 | 5.40 | 7.40 | 10.94 |
| South Africa | 43 | 32.63 | 5.48 | 4.72 | 10.71 |
| India | 78 | 34.83 | 5.52 | 4.33 | 9.79 |
| New Zealand | 82 | 32.80 | 5.55 | 6.15 | 9.70 |
As mentioned earlier, the Providence Stadium, Guyana, and Warner Park in Basseterre, St Kitts, are at opposite ends of the spectrum in terms of ODI run rates among venues in the West Indies. In ODIs since the beginning of 2007, Warner Park has seen a rate of 5.53 per over, compared to 4.52 in Providence. Of the 11 highest ODI totals in the West Indies - all of which have been made since the start of 2007 - five have been at Warner Park, including three out of six 350-plus totals.
While there have been seven 300-plus totals in 16 matches in St Kitts, there has been only one such score - 303 by Sri Lanka in a World Cup game against West Indies in 2007 - in Providence in as many games. Overall, there have been only 39 300-plus ODI totals in the West Indies, compared to 97 in India and 74 in Australia. Clearly, the ODI game is played to a different rhythm in the West Indies.
| Venue | ODIs | Average | Run rate | 300+ totals |
| Basseterre, St Kitts | 16 | 32.15 | 5.53 | 7 |
| Gros Islet, St Lucia | 18 | 33.02 | 5.07 | 2 |
| North Sound, Antigua | 13 | 30.87 | 5.00 | 3 |
| St George's, Grenada | 13 | 32.29 | 4.93 | 3 |
| Kingston, Jamaica | 18 | 30.68 | 4.90 | 6 |
| Port of Spain, Trinidad | 15 | 27.22 | 4.86 | 4 |
| Bridgetown, Barbados | 11 | 26.22 | 4.78 | 2 |
| Providence, Guyana | 16 | 25.23 | 4.52 | 1 |
S Rajesh is stats editor of ESPNcricinfo. Follow him on Twitter