SA's unmatched record in deciders
South Africa, who have the best record in series deciders among Test teams, will seek their first series win in India
Shiva Jayaraman
24-Oct-2015
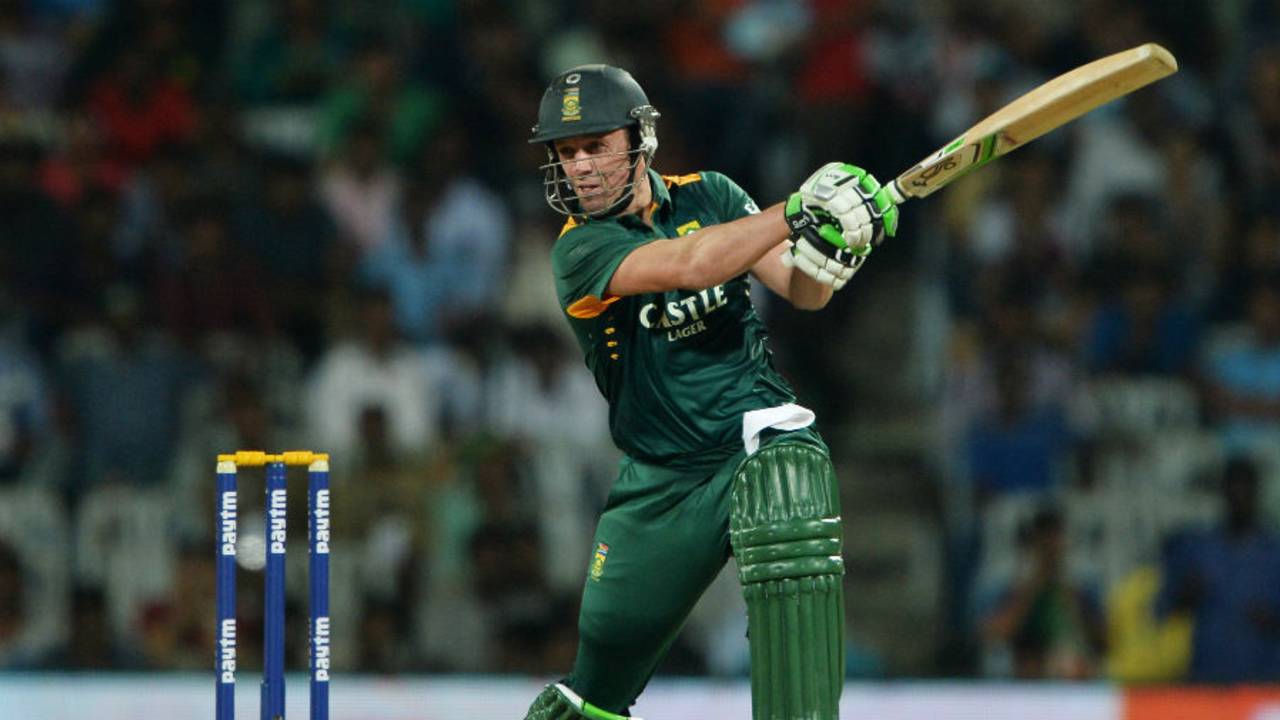
Unlike AB de Villiers, the other South Africa batsmen haven't been able to dictate terms against India's spinners. • AFP
0 Number of times India or South Africa have won an away bilateral series against each other from eight previous instances. South Africa had come close to achieving it in 2005-06, before they lost the fifth ODI of the five-match series to concede a 2-2 draw to the hosts. The third match of that series was abandoned. The current series is South Africa's fifth in India involving two or more ODIs. They had lost 1-2 in a three-match series the last time they had played, in 2009-10.
10-3 South Africa's win-loss record in deciding matches of a bilateral series - their win-loss ratio of 3.33 in such games is the best among the Test teams. However, the last instance of them losing in such a decider came recently, against Bangladesh this year, when they lost the third and final match. They have played two such deciders against India and have won both of them. India have a 11-9 record in such games.
| Team | Mats | Won | Lost | NR | W/L Ratio |
| RSA | 13 | 10 | 3 | 0 | 3.33 |
| AUS | 16 | 10 | 5 | 1 | 2.00 |
| SL | 14 | 7 | 5 | 2 | 1.40 |
| IND | 21 | 11 | 9 | 1 | 1.22 |
| ENG | 25 | 12 | 12 | 1 | 1.00 |
| NZ | 23 | 10 | 10 | 3 | 1.00 |
| WI | 16 | 7 | 8 | 1 | 0.87 |
| BDESH | 10 | 4 | 6 | 0 | 0.66 |
| PAK | 28 | 10 | 17 | 1 | 0.58 |
| ZIM | 13 | 4 | 9 | 0 | 0.44 |
1 Number of times teams batting first have won all the ODIs in a bilateral series involving five or matches. This happened between Pakistan and South Africa in the UAE in 2013. In the current series between India and South Africa, all the four matches so far have been won by teams batting first.
8 Number of instances of a bilateral ODI series in India being level going into the final match before the current one. The last such instance was against West Indies in 2013 when the series was level 1-1. India had won the last ODI to take that series.
3-0 India' win-loss record against South Africa at Wankhede Stadium, the venue of the final ODI. The last time the two teams played an ODI against each other at this venue was in 2005, which the hosts won to level a five-match series 2-2. Including their three wins against South Africa, India have won seven of their last ten ODIs at this venue. The last time they lost at Wankhede was in 2003 against Australia.
2009 The last time India lost a bilateral ODI series involving five or more matches at home - Australia had won 4-2 in a best of seven-match contest on that occasion. Since then, India have remained unbeaten in seven consecutive series.
215.38 AB de Villiers' strike-rate in the last ten overs of the innings in this series. He has made 84 runs off 39 balls and has been dismissed twice. Rohit Sharma has also done well in these overs having scored 42 off 21. Besides Rohit, India's batsmen in the top seven have not been able to score rapidly in the last ten overs. They have made 231 runs in 195 balls at a strike rate of 118.46 as opposed to South Africa batsmen's strike-rate of 143.65.
| Team | Runs | Balls | Dis | SR | Ave |
| India | 231 | 195 | 12 | 118.46 | 19.25 |
| South Africa | 181 | 126 | 6 | 143.65 | 30.16 |
29.30 Hashim Amla's batting average in his last ten ODI innings. Amla has made just one fifty-plus score in these innings - a hundred against New Zealand in Centurion. Excluding that knock, Amla has scored only 169 runs in nine innings since the World Cup with a highest of 44 against New Zealand in Durban.
1 Number of fifty-plus opening stands in eight innings in this series - a 72-run partnership between Quinton de Kock and David Miller in the third ODI in Rajkot. The opening stands have totally made 307 runs at an average of 38.37. While South Africa's opening stands have been affected by Amla's indifferent form, Shikhar Dhawan hasn't been doing well for India, having made 66 runs in four innings with a highest of 23.
5.71 Kagiso Rabada's economy-rate in the last five overs of the innings. He has bowed 22 dot balls and has conceded just two boundaries off seven overs. He has dismissed four batsmen, including Virat Kohli and MS Dhoni, who has scored 25 off 26 balls from Rabada. Morne Morkel too has done well having conceded just nine runs from the two overs he has bowled in the last five. Overall, South Africa's bowlers have done much better than India's in the last five overs: 11 wickets at an economy of 6.90, compared to only four at 8.26.
| Bowling Team | 4s | 6s | Balls | Econ | Wkt | Balls/boundary |
| South Africa | 7 | 4 | 120 | 6.90 | 11 | 10.9 |
| India | 9 | 6 | 90 | 8.26 | 4 | 6.0 |
4.71 Economy of India's spinners in this series; they have taken 15 wickets in four games at an average of 32.93. In contrast, India' fast bowlers have conceded 6.28 an over and have taken 13 wickets at 43.00 apiece. The fast bowlers have been particularly ineffective with the new ball: they have leaked 6.12 an over in the first 15 overs and have only one wicket from the 33 overs they have bowled in this period. India's spinners have bowled tight lines in the first 15 and have gone at 3.66. Their six wickets in these overs have come at an excellent average of 16.50.
| Bowling Style | Conc | Balls | Eco | Wkt | Ave |
| pace bowler | 202 | 198 | 6.12 | 1 | 202.00 |
| spin bowler | 99 | 162 | 3.66 | 6 | 16.50 |
129 AB de Villiers' average against India's spinners as opposed to an average of 25.78 per dismissal for the other South Africa batsmen. While De Villiers has struck at 94, the other batsmen have a collective strike-rate of 73.5 against spin. Overall, the South Africa batsmen have conceded 15 wickets in four ODIs to spinners at an average of 32.67 per dismissal and have struck at 78. In contrast, when Australia had played a seven-match ODI series in India in 2013-14, their batsmen had done better, conceding 19 wickets from six innings at an average of 46.89 and a strike0rate of 98.67.
| Series | Inns | Runs | Dis | Ave | SR |
| Australia in India, 2013-14 | 6 | 891 | 19 | 46.89 | 98.66 |
| South Africa in India, 2015-16 | 4 | 490 | 15 | 32.66 | 77.99 |
Shiva Jayaraman is a senior sub-editor (stats) at ESPNcricinfo.com