When dot balls didn't matter
West Indies had a higher dot-ball percentage than any of the other sides who reached the Super Eights. But they had the power-hitters to compensate for that
S Rajesh
09-Oct-2012
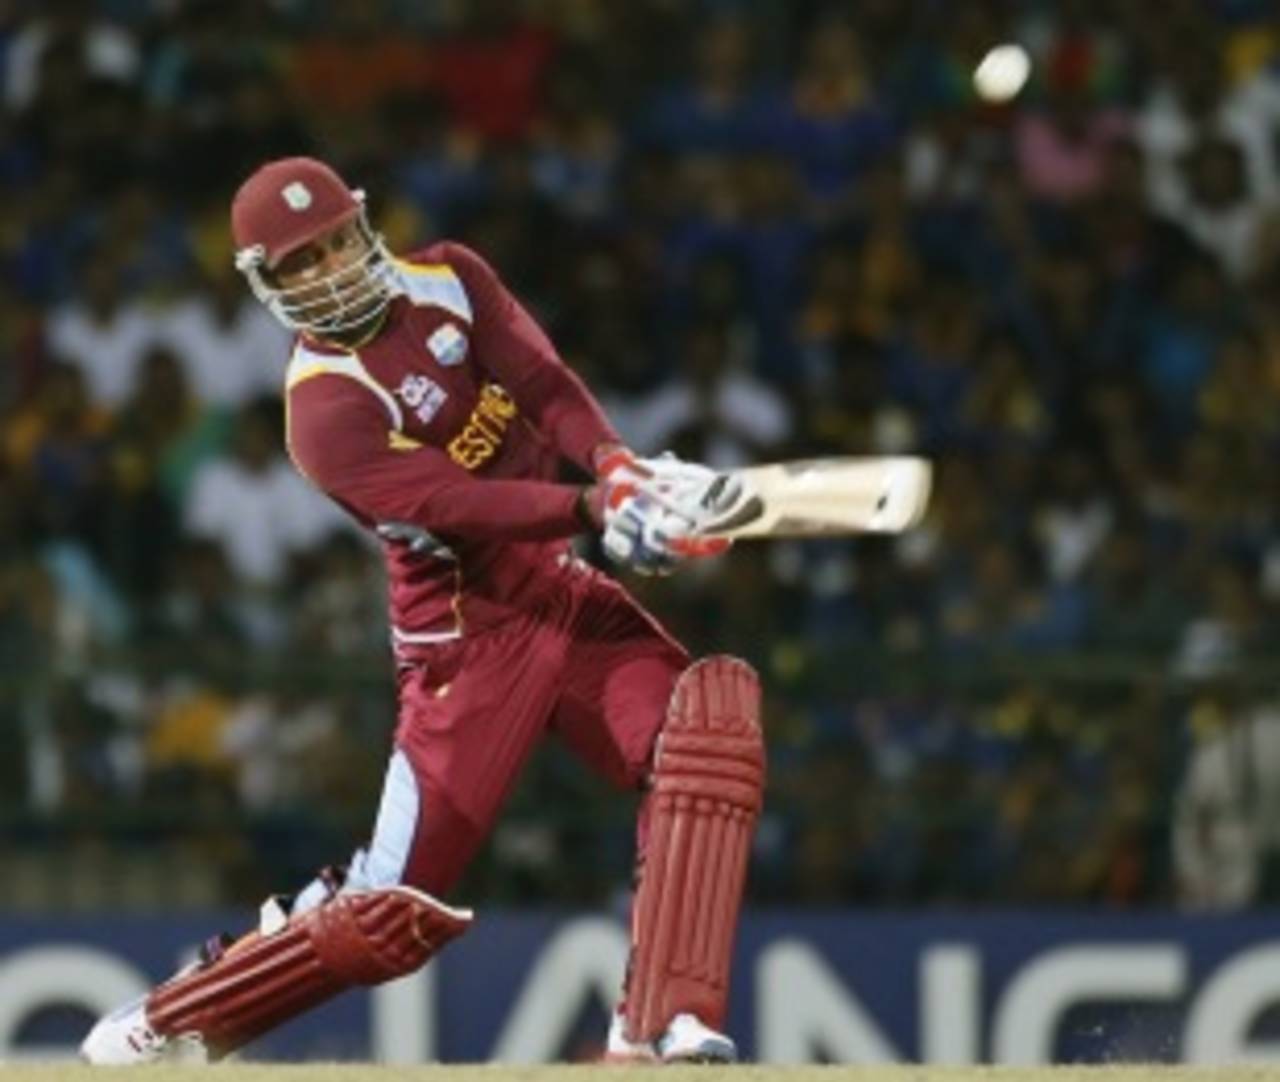
The victory margin in the final was 36 runs, which is exactly the number of extra runs West Indies scored in sixes compared to Sri Lanka • Associated Press
West Indies weren't the most consistent team in the tournament, but they won the 2012 World Twenty20 because they raised their game when it mattered the most, and played the knockout stages better than anyone else. However, not many will grudge them their success because of the way they played their cricket. As Sambit Bal wrote, they're the second-favourite team for most non-West Indians - and the way they played the tournament, and celebrated their victory, was nothing if not hugely entertaining.
The presence of so many power-hitters in West Indies' batting line-up gave them a distinct advantage, and they played to that strength throughout. Their run rate of 8.20 per over was the best among all teams, with Australia and New Zealand being the only other sides to score at more than eight per over. However, while New Zealand and Australia achieved those run rates by reducing their dot-ball percentages - New Zealand's percentage of 35.33 was the lowest of all sides - West Indies went completely the other way: their dot-ball percentage of 43.24 was highest among the teams which made it to the Super Eights, and yet their run rate was also the highest. That's because of the ability of several of their batsmen to hit the ball long and hard so often that they didn't to bother about such trivialities as taking singles and twos.
That attitude was reflected in the final as well, as West Indies played out 51 dot balls to Sri Lanka's 50. Yet West Indies won the match handily, and the winning margin of 36 runs was exactly the number of extra runs West Indies scored in sixes: they struck 7, to Sri Lanka's 1.
Overall, West Indies averaged 5.81 balls per boundary (a four or a six), which was marginally better than the next best, but in terms of sixes the difference was much more. West Indies' 49 sixes for the tournament was 18 better than the second-best - Australia's 31. In terms of balls per six, West Indies averaged 14.69, while Australia were next at 18.16. Among the teams that struggled to hit sixes were Sri Lanka and India: Sri Lanka averaged 40.61 balls per six, while India's average was 48.67 (12 sixes in 584 balls).
As a bowling unit, Sri Lanka and South Africa were the best, with economy rates of 7.15. South Africa were the most frugal in conceding boundaries, giving away a four or a six every 8.19 balls. Their average for conceding a six was 39.08 balls, while Pakistan's was 44.06.
For a team which was bounced out before the semi-finals, India's numbers were pretty impressive too: their batting average was the second-best, their bowling average the best, and their dot-ball percentage with the ball the highest.
| Team | 4s/ 6s scored | Balls per boundary | 4s/ 6s conceded | Balls per boundary | Dot-ball %-bat | Dot-ball %-bowl |
| West Indies | 75/ 49 | 5.81 | 74/ 26 | 7.18 | 43.24 | 39.55 |
| Sri Lanka | 89/ 18 | 6.83 | 66/ 28 | 7.96 | 38.02 | 44.04 |
| Australia | 63/ 31 | 5.99 | 82/ 34 | 6.22 | 39.04 | 40.14 |
| Pakistan | 81/ 24 | 6.76 | 87/ 16 | 6.84 | 41.81 | 38.60 |
| India | 74/ 12 | 6.79 | 50/ 24 | 7.22 | 35.40 | 46.14 |
| South Africa | 48/ 14 | 7.73 | 49/ 13 | 8.19 | 35.85 | 44.47 |
| England | 61/ 28 | 6.35 | 68/ 23 | 6.43 | 40.46 | 44.86 |
| New Zealand | 65/ 26 | 6.62 | 64/ 27 | 6.51 | 35.33 | 37.29 |
| Team | Matches | Won/lost | Bat ave/ Run rate | Bowl ave/ Econ rate | Ave diff | Run rate diff |
| West Indies | 7 | 4/ 2 | 25.78/ 8.20 | 22.92/ 7.52 | 2.86 | 0.68 |
| Sri Lanka | 7 | 5/ 2 | 26.13/ 7.77 | 18.56/ 7.15 | 7.57 | 0.62 |
| Australia | 6 | 4/ 2 | 31.70/ 8.13 | 25.78/ 7.95 | 5.92 | 0.18 |
| Pakistan | 6 | 4/ 2 | 22.84/ 7.55 | 25.20/ 7.32 | -2.36 | 0.23 |
| India | 5 | 4/ 1 | 31.25/ 7.73 | 15.51/ 7.18 | 15.74 | 0.55 |
| South Africa | 5 | 2/ 3 | 24.08/ 7.57 | 19.79/ 7.15 | 4.29 | 0.42 |
| England | 5 | 2/ 3 | 23.09/ 7.90 | 24.06/ 7.66 | -0.97 | 0.24 |
| New Zealand | 5 | 1/ 4 | 25.50/ 8.16 | 22.67/ 7.84 | 2.83 | 0.32 |
The batting stars
The two batsmen who shone consistently for West Indies were Chris Gayle and Marlon Samuels. Both finished among the top four run-getters, at strike rates of more than 130, and were also among the top three six hitters.
The two batsmen who shone consistently for West Indies were Chris Gayle and Marlon Samuels. Both finished among the top four run-getters, at strike rates of more than 130, and were also among the top three six hitters.
As a batting unit, West Indies' strength was clearly in the middle and final overs. In the Powerplay, they only averaged 6.66 runs per overs. In the middle overs (6 to 15), they averaged 8.20 runs per over - next only to Australia's 8.75 - and averaged 44.30 runs per wicket. The high average meant they didn't lose too many wickets during these overs, which meant they had wickets in hand during the last five. Their run rate during this stage was 10.06 runs per over. Both Gayle and Samuels had relatively high dot-ball percentages, but they made up for that by getting plenty of runs in boundaries - for Gayle, the percentage of runs scored in fours and sixes was 77.48.
Shane Watson was the leading run-scorer of the tournament, and apart from his boundary-hitting prowess, his low dot-ball percentage was also impressive.
| Batsman | Runs | Balls | Average | Strike rate | 4s/ 6s | Boundary% | Dot-ball% |
| Shane Watson | 249 | 166 | 49.80 | 150.00 | 19/ 15 | 66.67 | 35.54 |
| Mahela Jayawardene | 243 | 209 | 40.50 | 116.26 | 29/ 5 | 60.08 | 45.45 |
| Marlon Samuels | 230 | 173 | 38.33 | 132.94 | 14/ 15 | 63.48 | 40.46 |
| Chris Gayle | 222 | 148 | 44.40 | 150.00 | 19/ 16 | 77.48 | 44.59 |
| Brendon McCullum | 212 | 133 | 42.40 | 159.39 | 20/ 10 | 66.04 | 32.33 |
| Luke Wright | 193 | 114 | 48.25 | 169.29 | 14/ 13 | 69.43 | 30.70 |
| Virat Kohli | 185 | 151 | 46.25 | 122.51 | 20/ 4 | 57.14 | 34.21 |
| Tillakaratne Dilshan | 179 | 148 | 25.57 | 120.94 | 17/ 4 | 51.40 | 33.78 |
Spin on top
With pitches generally getting slower as the tournament went on, and the last three games held at the spin-friendly Premadasa Stadium in Colombo, the overall stats in the tournament finished in favour of the spinners. The averages were almost the same, but the economy rates were much better for spinners - there was a difference of more than one run per over between the economy rates of pace and spin.
With pitches generally getting slower as the tournament went on, and the last three games held at the spin-friendly Premadasa Stadium in Colombo, the overall stats in the tournament finished in favour of the spinners. The averages were almost the same, but the economy rates were much better for spinners - there was a difference of more than one run per over between the economy rates of pace and spin.
| Bowling type | Wickets | Balls | Average | Econ rate | 4s/ 6s conceded |
| Pace | 166 | 3158 | 25.07 | 7.90 | 435/ 114 |
| Spin | 125 | 2652 | 24.35 | 6.88 | 208/ 106 |
The three leading spinners in the tournament were Sunil Narine, Ajantha Mendis and Saeed Ajmal. All three of them had economy rates of less than seven, with Narine excelling in that department. In terms of wickets, Mendis was outstanding - his haul of 15 is the highest in any World Twenty20, going past Dirk Nannes' 14 in the 2010 tournament.
| Bowler | Balls | Wickets | Average | Econ rate | 4s/ 6s conceded |
| Sunil Narine | 148 | 9 | 15.44 | 5.63 | 8/ 3 |
| Ajantha Mendis | 144 | 15 | 9.80 | 6.12 | 11/ 5 |
| Saeed Ajmal | 144 | 9 | 18.11 | 6.79 | 19/ 2 |
Among the fast bowlers, Watson and Mitchell Starc were the two best in terms of wickets. Watson's 11 wickets came at an average of 16 and an economy rate of 7.33, while Starc was superb with his economy rate too (6.83), while his ten wickets cost him 16.40 each.
L Balaji was the most successful bowler for India with nine wickets, and while West Indies' Ravi Rampaul took as many wickets too - mostly with outstanding new-ball bowling - his length deliveries at the death cost West Indies a few runs. Steven Finn and Tim Southee were the other fast bowlers who impressed, but Lasith Malinga had a surprisingly poor tournament - though he managed eight wickets, his economy rate was a poor 8.44. (Click here for the leading wicket-takers in the 2012 World Twenty20.)
The overall numbers
Comparing the overall stats for the four World Twenty20 tournaments, it's surprising to see how similar they are. The first edition, in South Africa, had the highest run rate, but since then the scoring rates have stayed within the narrow band between 7.53 and 7.63. The one significant difference between the first edition and the others is also the number of 200-plus scores: in 2007 there were five scores of 200 or more - including two matches when both teams scored more than 200. Since then, there've been only two more 200-plus totals in three tournaments. (Click here for the high totals in World Twenty20 tournaments.)
Comparing the overall stats for the four World Twenty20 tournaments, it's surprising to see how similar they are. The first edition, in South Africa, had the highest run rate, but since then the scoring rates have stayed within the narrow band between 7.53 and 7.63. The one significant difference between the first edition and the others is also the number of 200-plus scores: in 2007 there were five scores of 200 or more - including two matches when both teams scored more than 200. Since then, there've been only two more 200-plus totals in three tournaments. (Click here for the high totals in World Twenty20 tournaments.)
| Year | Runs | Wickets | Average | Run rate | 4s/ 6s | 200+ scores |
| 2007 | 7881 | 348 | 22.64 | 7.99 | 659/ 265 | 5 |
| 2009 | 7625 | 337 | 22.62 | 7.62 | 667/ 166 | 1 |
| 2010 | 7413 | 346 | 21.42 | 7.53 | 504/ 278 | 0 |
| 2012 | 7448 | 315 | 23.64 | 7.63 | 645/ 223 | 1 |
S Rajesh is stats editor of ESPNcricinfo. Follow him on Twitter