Visitors' inconsistency masks India's shortcomings
Although India completed a comfortable series win, their job was made far easier by the New Zealand batsmen who often failed to capitalise on starts
Madhusudhan Ramakrishnan
04-Sep-2012
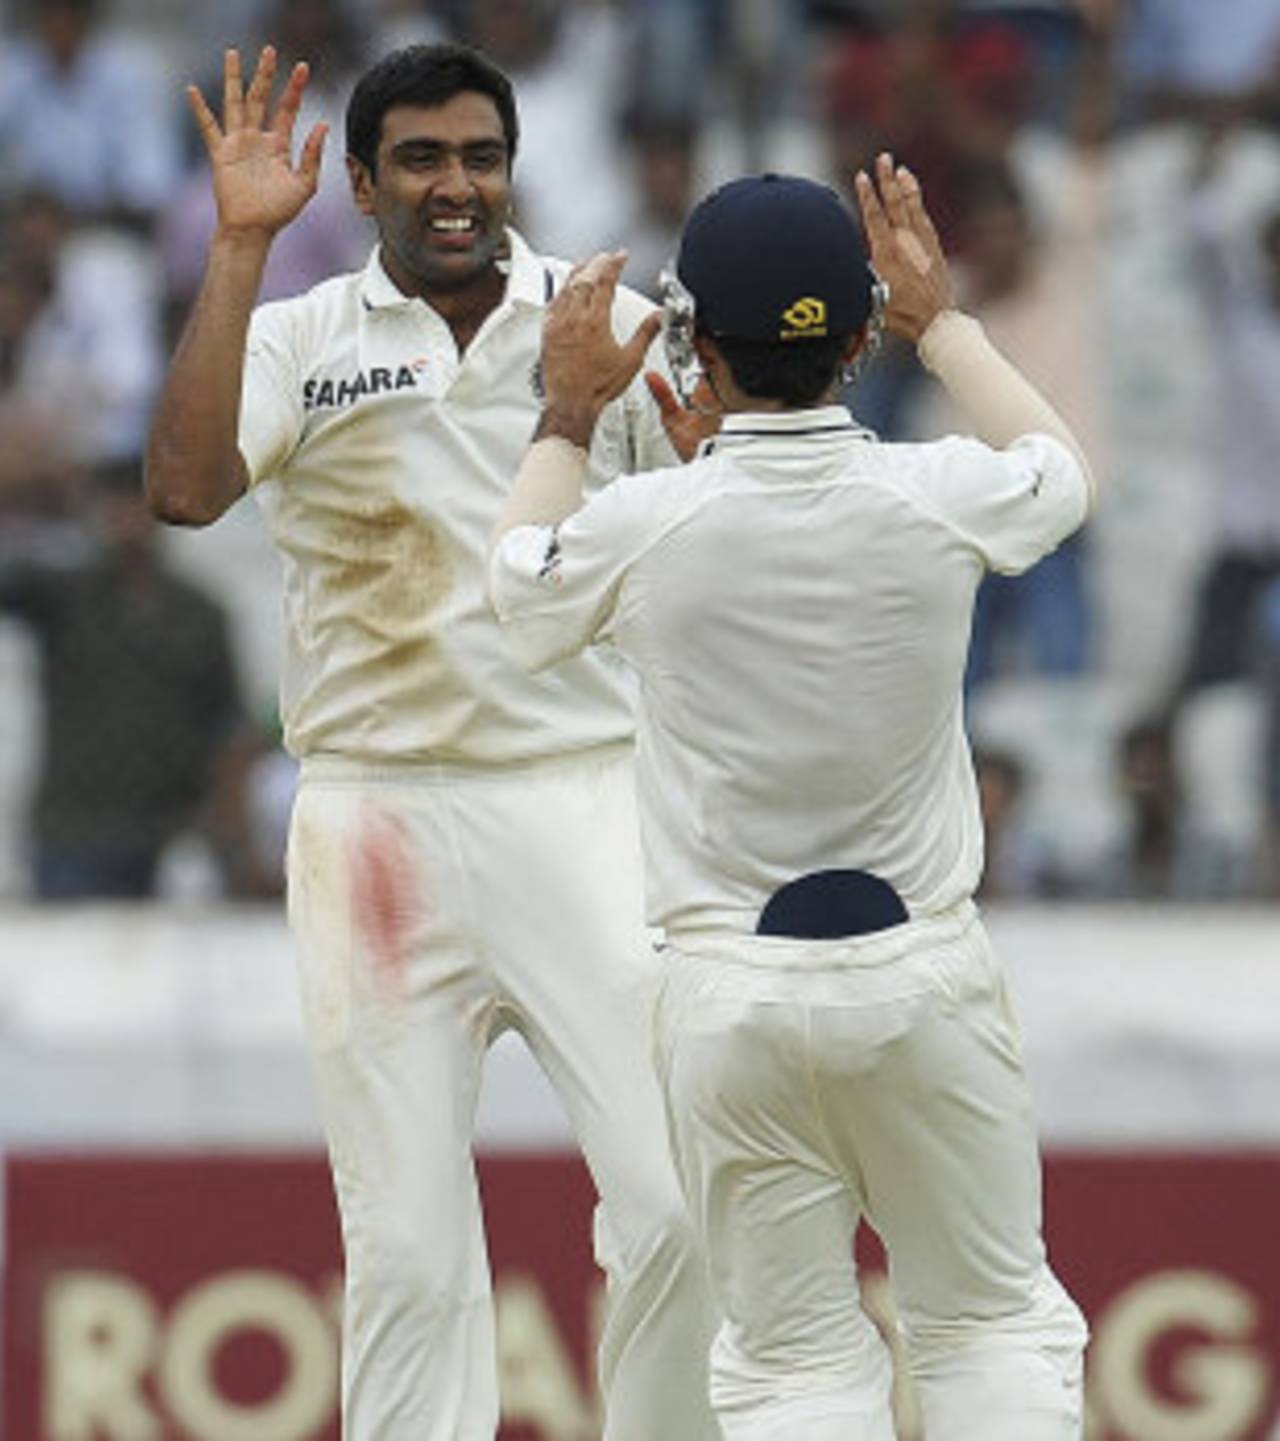
R Ashwin finished with 18 wickets as Indian spinners dominated the wickets tally • AFP
In the last 14 months, very little has gone right for India on the Test front with their ranking dropping from No.1 to 5 after consecutive 4-0 whitewashes in England and Australia. However, one factor that has not changed in the last few years has been India's exceptional form in home Tests. Although the opposition teams in the last two home series (West Indies and New Zealand) have not been the most consistent, there seemed little doubt about the results once India got back to playing in familiar conditions. New Zealand, who arrived after being outclassed by West Indies, were all at sea in spin-friendly conditions in the first Test in Hyderabad. Spurred by Ross Taylor's superb century in Bangalore, the visitors had a firm grip on the game only to concede the advantage to India after a poor batting display in the second innings. India's bowlers, who benefited vastly from New Zealand's largess, will be much more severely tested when they face up against England and Australia in the coming months.
Kohli, Pujara prop up India
India fielded an inexperienced batting line-up following the retirements of Rahul Dravid and VVS Laxman. Even as the top batsmen including Sachin Tendulkar struggled to post the big scores, Cheteshwar Pujara and Virat Kohli stepped up to score centuries. Pujara, who made his debut in Bangalore two years back against Australia, set up India's innings win in Hyderabad with an excellent 159. Kohli carried his brilliant run in ODIs into the Test arena and ended up with scores of 58, 103 and 51 in his three knocks. In Bangalore, he became only the sixth Indian batsman to score a century and fifty in the same game against New Zealand. The openers came good in the final innings in Bangalore but failed to make the most of their starts. In the second Test, the top-four batsmen failed to score a single half-century. The aggregate (218 runs) is the highest ever for India's top four, without a single fifty-plus score. Tendulkar, who was bowled in three consecutive innings for only the second time in his career, added to his records tally when he went past Dravid's fourth-innings aggregate during the course of his second innings in Bangalore.
India fielded an inexperienced batting line-up following the retirements of Rahul Dravid and VVS Laxman. Even as the top batsmen including Sachin Tendulkar struggled to post the big scores, Cheteshwar Pujara and Virat Kohli stepped up to score centuries. Pujara, who made his debut in Bangalore two years back against Australia, set up India's innings win in Hyderabad with an excellent 159. Kohli carried his brilliant run in ODIs into the Test arena and ended up with scores of 58, 103 and 51 in his three knocks. In Bangalore, he became only the sixth Indian batsman to score a century and fifty in the same game against New Zealand. The openers came good in the final innings in Bangalore but failed to make the most of their starts. In the second Test, the top-four batsmen failed to score a single half-century. The aggregate (218 runs) is the highest ever for India's top four, without a single fifty-plus score. Tendulkar, who was bowled in three consecutive innings for only the second time in his career, added to his records tally when he went past Dravid's fourth-innings aggregate during the course of his second innings in Bangalore.
New Zealand were also guilty of frittering away good starts. Of the 44 innings, they had 12 scores between 20 and 49 (27.27%) and a very high percentage of single-digit scores (34.09%). With the opening partnership yielding just 81 runs in four innings, the middle order was always under pressure. Taylor and Kruger van Wyk gave New Zealand hope with fighting knocks in the first innings in Bangalore but as was often the case throughout the series, a flurry of wickets ended the visitors' chances of dominating the game.
| Team | Innings | Runs | Average | 100/50 | 0-9 scores | 20-49 scores |
| India | 29 | 1006 | 40.24 | 2/5 | 9 | 8 |
| New Zealand | 44 | 886 | 22.15 | 1/3 | 15 | 12 |
New Zealand fail to score big
Since the beginning of 2011, New Zealand have regularly struggled to convert starts into substantial scores. Not only do they have a very high ratio of fifties to centuries in this period but also have a high percentage of scores between 20 and 49 (22.43%). The story was not very different in 2007 and 2008. In 16 matches played in that period, New Zealand averaged just 25.69 and had a high ratio of fifties to centuries (6:1). However, the percentage of scores between 20 and 49 was lower (18.81%). In 2009 and 2010, New Zealand had the best batting record. In 14 matches, they scored 16 centuries and 32 fifties and averaged 31.47. The problem with throwing away starts refused to go away though; they had 62 out of 271 innings between 20 and 49 (22.87%). New Zealand's overall numbers since 2007 also illustrate their problems clearly. In over a fifth of their innings (21.26%), the batsmen have been dismissed between 20 and 49 and their ratio of fifties to centuries (3.53) is the worst among top Test-playing teams in the period.
Since the beginning of 2011, New Zealand have regularly struggled to convert starts into substantial scores. Not only do they have a very high ratio of fifties to centuries in this period but also have a high percentage of scores between 20 and 49 (22.43%). The story was not very different in 2007 and 2008. In 16 matches played in that period, New Zealand averaged just 25.69 and had a high ratio of fifties to centuries (6:1). However, the percentage of scores between 20 and 49 was lower (18.81%). In 2009 and 2010, New Zealand had the best batting record. In 14 matches, they scored 16 centuries and 32 fifties and averaged 31.47. The problem with throwing away starts refused to go away though; they had 62 out of 271 innings between 20 and 49 (22.87%). New Zealand's overall numbers since 2007 also illustrate their problems clearly. In over a fifth of their innings (21.26%), the batsmen have been dismissed between 20 and 49 and their ratio of fifties to centuries (3.53) is the worst among top Test-playing teams in the period.
| Period | Matches | Innings | Average | 100/50 | 0-9 scores | 20-49 scores | % of 20-49 scores |
| 2007-2008 | 16 | 303 | 25.69 | 6/36 | 124 | 57 | 18.81 |
| 2009-2010 | 14 | 271 | 31.47 | 16/32 | 91 | 62 | 22.87 |
| 2011-present | 13 | 263 | 25.42 | 6/31 | 89 | 59 | 22.43 |
| Overall | 43 | 837 | 27.48 | 28/99 | 304 | 178 | 21.26 |
A comprehensive win
In their previous series in West Indies, New Zealand batsmen had struggled to pick the variations of Sunil Narine. So, it was hardly surprising that they were troubled by two quality Indian spinners on helpful tracks. The first Test in Hyderabad was completely one-sided. With R Ashwin picking up 12 wickets, New Zealand collapsed in both their innings to hand India their second-biggest win against the visitors. However, the second Test in Bangalore was a lot closer and it was only the superb 96-run sixth-wicket stand between Kohli and MS Dhoni that helped India get to the target.The average difference (18.72) for the series (difference between India's batting and bowling averages) is the second-highest in a home series for India since 2009 with the highest (25.14) coming against Sri Lanka in 2009-10. At the other extreme is the series against South Africa in 2010 where the average difference was just 1.96 in favour of India. The presence of New Zealand (twice) and West Indies in the top four demonstrates the problems faced by the visiting batsmen from these teams in India. On the flip side for India, their batting average in this series (42.12) is the second-lowest in the same period and well behind their average in the 2009 series against Sri Lanka (66.84).
In their previous series in West Indies, New Zealand batsmen had struggled to pick the variations of Sunil Narine. So, it was hardly surprising that they were troubled by two quality Indian spinners on helpful tracks. The first Test in Hyderabad was completely one-sided. With R Ashwin picking up 12 wickets, New Zealand collapsed in both their innings to hand India their second-biggest win against the visitors. However, the second Test in Bangalore was a lot closer and it was only the superb 96-run sixth-wicket stand between Kohli and MS Dhoni that helped India get to the target.The average difference (18.72) for the series (difference between India's batting and bowling averages) is the second-highest in a home series for India since 2009 with the highest (25.14) coming against Sri Lanka in 2009-10. At the other extreme is the series against South Africa in 2010 where the average difference was just 1.96 in favour of India. The presence of New Zealand (twice) and West Indies in the top four demonstrates the problems faced by the visiting batsmen from these teams in India. On the flip side for India, their batting average in this series (42.12) is the second-lowest in the same period and well behind their average in the 2009 series against Sri Lanka (66.84).
| Opposition | Year | Result | Bat avg (India) | Bowl avg (India) | Avg diff |
| Sri Lanka | 2009-10 | 2-0 | 66.84 | 41.70 | 25.14 |
| New Zealand | 2012 | 2-0 | 42.12 | 23.40 | 18.72 |
| New Zealand | 2010-11 | 1-0 | 48.92 | 33.61 | 15.31 |
| West Indies | 2011-12 | 2-0 | 44.87 | 30.40 | 14.47 |
| Australia | 2010-11 | 2-0 | 41.34 | 33.02 | 8.32 |
| South Africa | 2010 | 1-1 | 45.96 | 44.00 | 1.96 |
Indian spinners make hay
Ashwin and Pragyan Ojha combined to pick up 31 of the 40 New Zealand wickets to fall. In India's innings win in Hyderabad, Ashwin picked up 12 for 85, the second-best bowling figures against New Zealand after Courtney Walsh's 13 for 55 in Wellington in 1995. Ojha, who became the first specialist India spinner to open the bowling in a Test (in the second Test in Bangalore), ended with 13 wickets including a five-for in the first innings in the second Test. While Ashwin was equally successful against right-handers (12 wickets at 13.25) and left-handers (six wickets at 12.83), 12 of Ojha's 13 wickets came were those of right-handers (12 wickets at 16.16). Against left-handers, Ojha had very little impact picking up one wicket at an average of 46.00.
Ashwin and Pragyan Ojha combined to pick up 31 of the 40 New Zealand wickets to fall. In India's innings win in Hyderabad, Ashwin picked up 12 for 85, the second-best bowling figures against New Zealand after Courtney Walsh's 13 for 55 in Wellington in 1995. Ojha, who became the first specialist India spinner to open the bowling in a Test (in the second Test in Bangalore), ended with 13 wickets including a five-for in the first innings in the second Test. While Ashwin was equally successful against right-handers (12 wickets at 13.25) and left-handers (six wickets at 12.83), 12 of Ojha's 13 wickets came were those of right-handers (12 wickets at 16.16). Against left-handers, Ojha had very little impact picking up one wicket at an average of 46.00.
On wickets that were hardly conducive for pace bowling, Tim Southee produced an outstanding performance in Bangalore finishing with 7 for 64 in the first innings. Trent Boult and Doug Bracewell were far better than their final figures suggested. Zaheer Khan, who became the third Indian pace bowler to pick up 100 wickets, was well below par while Umesh Yadav proved expensive (economy rate of 4.36).
| Team | Bowler type | Right handers (Wickets,avg) | Left handers(wickets,avg) | Overall (wickets,avg) |
| India | Pace | 8, 42.75 | 0, - | 8, 49.12 |
| New Zealand | Pace | 12, 53.41 | 5, 20.40 | 17, 43.70 |
| India | Spin | 24, 14.87 | 7, 19.57 | 31, 15.93 |
| New Zealand | Spin | 5, 51.20 | 2, 10.50 | 7, 39.57 |
The wickets tally for India in the series was completely skewed in favour of spinners. While the spinners ended with 31 wickets at 15.93, the pace bowlers managed just eight wickets at 49.12. The ratio of spin to pace wickets in this series is 3.87. Since 2000, there have been only two other series where the ratio of wickets taken by spinners to those picked up by pace bowlers has been greater. In the 2001 series against Australia, when Harbhajan Singh ended with 32 wickets in three Tests, the ratio was 5.12 (spinners 41 wickets and fast bowlers eight wickets). Second on the list is the 2004 series against Australia where the ratio was 4.61. It is also the first time since the 2008 series against South Africa that Indian pace bowlers have failed to pick up ten or more wickets in a home series.
*Only series in India where spinners have picked up 30 wickets or more
| Opposition | Year | Matches | Spin wickets | Pace wickets | Spin wickets/pace wickets |
| Australia | 2001 | 3 | 41 | 8 | 5.12 |
| Australia | 2004 | 4 | 60 | 13 | 4.61 |
| New Zealand | 2012 | 2 | 31 | 8 | 3.87 |
| South Africa | 2008 | 3 | 32 | 9 | 3.55 |
| Sri Lanka | 2005 | 3 | 34 | 10 | 3.40 |
| England | 2001 | 3 | 36 | 11 | 3.27 |
With the win in Bangalore, Dhoni went past Mohammad Azharuddin on the list of Indian captains with the most home Test wins (14). Dhoni's win-loss ratio in home Tests is extremely impressive (14.00) with the solitary loss coming against South Africa in Nagpur in 2010. Among captains who have led in at least 20 home Tests, Dhoni has the best win-loss ratio followed by Steve Waugh (11.00) and Javed Miandad (10.00). In sharp contrast, his captaincy record away is extremely poor; in 19 away Tests under Dhoni, India have won five and lost nine (w/l ratio 0.55).
Madhusudhan Ramakrishnan is a sub-editor (stats) at ESPNcricinfo