Chasing away the blues in Sri Lanka
Batting second under lights in Sri Lanka - specifically at the Premadasa Stadium - has become a lot easier recently
S Rajesh
03-Aug-2012
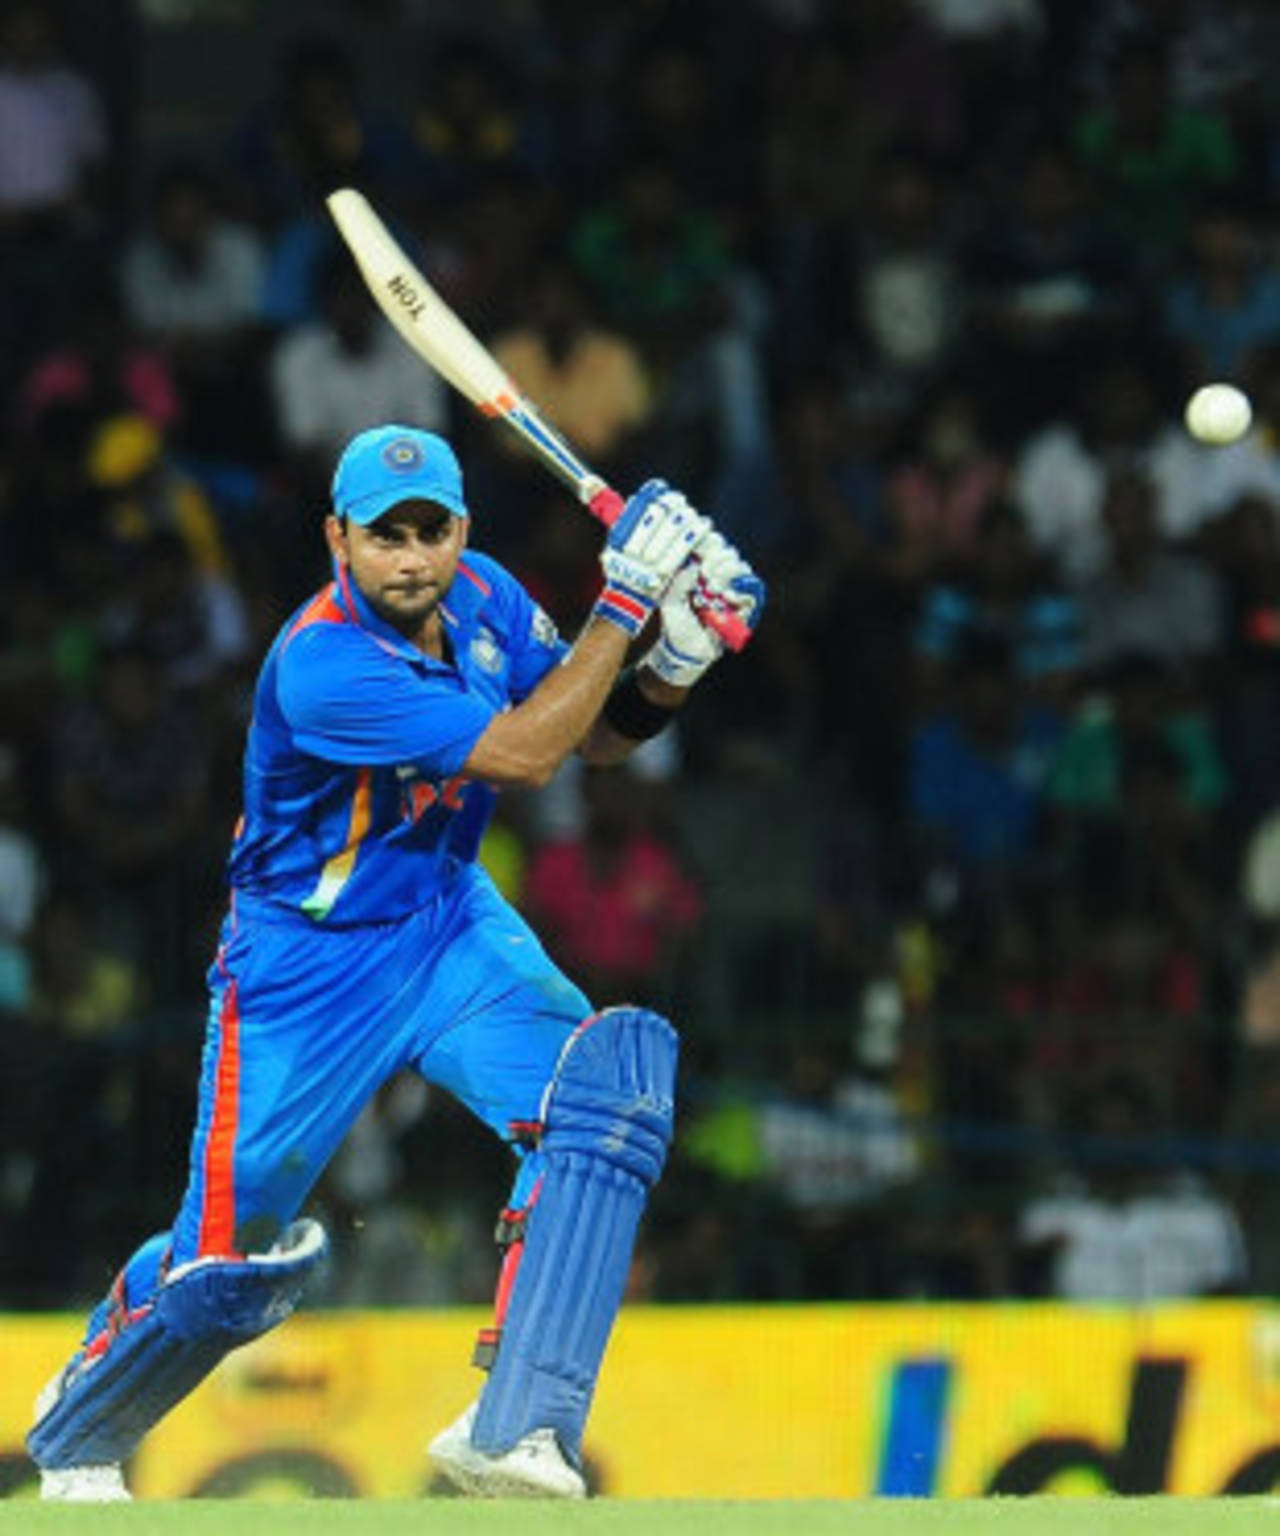
Thanks to Virat Kohli's heroics, India won two games in a row chasing 250-plus under lights against Sri Lanka in Sri Lanka • AFP
Something that had never happened before in an ODI in Sri Lanka happened more than once in the last week: the home team batted first in a day-night match, scored over 250, and lost. Twice in succession. On Saturday they scored 286, seemed set for victory, and then faltered as Suresh Raina and Irfan Pathan pulled off a tremendous sixth-wicket partnership; three days later, they scored 251, took early wickets, and were then thwarted by Virat Kohli and Raina. On 28 previous occasions when they had batted first in a day-night ODI at home and scored more than 250, they won every single game. Thirteen of those 28 wins were at the Premadasa Stadium, the ground where those two losses came last week.
These wins obviously came about due to the talent and skill of the Indian batting line-up, but the results also confirmed an overall recent trend in which chasing has become relatively more profitable in day-night ODIs the world over, and especially at the Premadasa.
There was a time, not very long ago, when batting first in a day-night ODI in Sri Lanka was a huge advantage. Between January 2000 and December 2009, teams batting second in a day-night ODI in the country won a mere 17 of 58 completed matches. In terms of win-loss ratio, that was by far the lowest among all host countries. The next-worst ratio was in Australia, but that was about 58% better for the team chasing than the ratio in Sri Lanka.
In the 61 matches under lights in Sri Lanka, the teams batting first averaged 31.49 runs per wicket, and 4.90 runs per over; for the teams batting second, these numbers dropped to 24.78 and 4.48. Sri Lanka had an 18-3 win-loss record when they batted first in these matches, with an average of 32.98 and a run rate of 4.95; however, even they couldn't fully adjust to chasing under lights at home over those ten years, winning only ten out of 25 such matches, scoring 27.29 per wicket and 4.73 per over.
In fact, there was a five-year period between July 2004 and September 2009 when, in 29 day-night matches, there wasn't a single century scored in a run-chase; the highest during that period was Marvan Atapattu's unbeaten 97 against South Africa in Dambulla. In the same period, there were seven hundreds in the first innings, including scores of 150 and 138.
Since then, however, the numbers have changed a bit in Sri Lanka. In 40 ODIs played under lights since the beginning of 2010, there have been six centuries in run-chases, including two in the same game - the World Cup quarter-final between Sri Lanka and England - and two more in a ten-day period during India's ongoing series there. The win-ratios have changed considerably too, from 0.41 to 1.17. In fact, teams chasing in day-night games there have won more often in the last 40 matches than in the previous 61. In percentage terms, the winning ratio for the team chasing under lights since 2010 is 185% better than it was between 2000 and 2009.
The countries where teams batting second have consistently struggled under lights are Australia and South Africa. In both, the win-loss ratio for the teams chasing is around 0.7 since 2000. In the last couple of years, though, the overall ratio has been looking much brighter for the teams batting second under lights - it's improved from 0.78 to 1.17.
| Host country | 2000-2009 - ODIs | W/L | Ratio | 2010 onwards - ODIs | W/L | Ratio |
| New Zealand | 56 | 31/22 | 1.40 | 14 | 9/5 | 1.80 |
| India | 61 | 31/27 | 1.14 | 36 | 19/16 | 1.18 |
| England | 30 | 13/13 | 1.00 | 18 | 8/5 | 1.60 |
| Pakistan | 62 | 29/33 | 0.87 | - | - | - |
| Bangladesh | 38 | 16/21 | 0.76 | 29 | 19/10 | 1.90 |
| South Africa | 89 | 34/46 | 0.73 | 12 | 4/8 | 0.50 |
| UAE | 61 | 25/36 | 0.69 | 17 | 9/8 | 1.12 |
| Australia | 126 | 47/72 | 0.65 | 34 | 14/18 | 0.77 |
| Sri Lanka | 61 | 17/41 | 0.41 | 40 | 20/17 | 1.17 |
| Overall | 593 | 246/315 | 0.78 | 195 | 102/87 | 1.17 |
| Host country | 2000-2009 - Average | Strike rate | 100s/ 50s | 2010 onwards - Average | Strike rate | 100s/ 50s |
| India | 30.43 | 79.80 | 12/ 65 | 31.93 | 84.95 | 10/ 42 |
| Pakistan | 30.02 | 76.47 | 9/ 82 | - | - | - |
| England | 28.01 | 74.28 | 3/ 25 | 30.20 | 86.32 | 1/ 16 |
| New Zealand | 27.56 | 78.03 | 9/ 60 | 31.45 | 82.39 | 2/ 15 |
| Australia | 25.84 | 73.04 | 21/ 111 | 27.12 | 80.92 | 4/ 36 |
| Bangladesh | 25.71 | 70.19 | 4/ 36 | 37.19 | 81.25 | 9/ 37 |
| UAE | 25.04 | 68.47 | 8/ 60 | 28.48 | 77.82 | 3/ 21 |
| South Africa | 24.43 | 71.73 | 12/ 68 | 21.69 | 75.95 | 1/ 9 |
| Sri Lanka | 22.69 | 67.89 | 8/ 44 | 26.71 | 74.16 | 6/ 38 |
In terms of specific venues in Sri Lanka, the big difference is in the stats for the Premadasa Stadium. Till 2009, teams batting second under lights used to win roughly one in four. Since the ground was redone for the 2011 World Cup, they have been winning three out of four.
| Ground | 2000-'09 - ODIs | W/L | Ratio | 2010 onwards - ODIs | W/L | Ratio |
| Premadasa Stadium | 48 | 11/ 34 | 0.32 | 14 | 9/ 3 | 3.00 |
| Pallekele | - | - | - | 6 | 3/ 3 | 1.00 |
| Dambulla | 13 | 6/ 7 | 0.85 | 14 | 6/ 7 | 0.85 |
| Hambantota | - | - | - | 6 | 2/ 4 | 0.50 |
Overall, though, Sri Lanka remains a fairly difficult country for batsmen. Since 2004, the average here is the lowest among all host countries, and the run rate's better only than that in Bangladesh. Scoring has been a problem both for the home team and the visitors: the overall average for Sri Lanka in home games during this period is only 30.94, which is well below the averages for India, South Africa, Pakistan and Australia. For visiting batsmen, the averages are even lower.
| Host country | Home - average | Run rate | Away - average | Run rate | Overall - average | Run rate |
| Pakistan | 36.79 | 5.42 | 31.92 | 5.28 | 33.82 | 5.34 |
| India | 39.84 | 5.67 | 30.43 | 5.20 | 33.25 | 5.36 |
| New Zealand | 33.91 | 5.52 | 31.88 | 5.07 | 32.87 | 5.29 |
| South Africa | 39.38 | 5.60 | 27.99 | 4.84 | 31.64 | 5.12 |
| England | 33.96 | 5.30 | 30.03 | 4.95 | 31.61 | 5.10 |
| Australia | 35.15 | 5.36 | 28.52 | 5.01 | 31.02 | 5.15 |
| Zimbabwe | 25.95 | 4.64 | 33.43 | 5.05 | 29.60 | 4.86 |
| West Indies | 30.15 | 4.99 | 29.05 | 4.85 | 29.40 | 4.89 |
| Bangladesh | 26.96 | 4.52 | 28.89 | 4.76 | 28.03 | 4.65 |
| Sri Lanka | 30.94 | 4.93 | 26.01 | 4.62 | 27.87 | 4.75 |
Among Sri Lanka's current players, a couple have slightly higher averages in away or neutral ODIs than in home games, which is quite different to their stats in Tests, where most of them have much better numbers at home. Kumar Sangakkara averages 39.71 away (including neutral venues) and 36.50 at home; Tillakaratne Dilshan averages 33.68 at home, and 36.24 overseas. Even Mahela Jayawardene, who has such a huge home-and-away discrepancy in Tests, has very similar home-and-away stats in ODIs: 34.74 at home, and 32.11 when playing away.
Overseas batsmen have mostly had problems in Sri Lanka, but over the last few years, many players from the subcontinent - most of them from India - have found a way to score runs there. (Indians, of course, have had the advantage of playing almost every year in Sri Lanka.) Most of the batsmen who have scored more than 500 ODI runs in Sri Lanka since 2004 are Indians, and they have pretty high averages too. The only non-Indian in the list below is Pakistan's Umar Akmal, who has a remarkable average of 49.83 in his 17 ODIs in Sri Lanka.
| Batsman | ODIs | Runs | Average | Strike rate | 100s/ 50s |
| Umar Akmal | 17 | 598 | 49.83 | 88.85 | 1/ 4 |
| Sachin Tendulkar | 13 | 512 | 46.54 | 78.89 | 1/ 3 |
| MS Dhoni | 32 | 1020 | 44.34 | 77.68 | 0/ 8 |
| Rahul Dravid | 15 | 502 | 41.83 | 71.71 | 1/ 4 |
| Gautam Gambhir | 17 | 671 | 39.47 | 86.13 | 2/ 4 |
| Virat Kohli | 17 | 546 | 36.40 | 76.25 | 2/ 1 |
S Rajesh is stats editor of ESPNcricinfo. Follow him on Twitter