Cook's stunning rise in ODIs
Once thought to be too slow for the format, Alastair Cook has transformed himself into one of the best ODI openers going around today
S Rajesh
22-Jun-2012
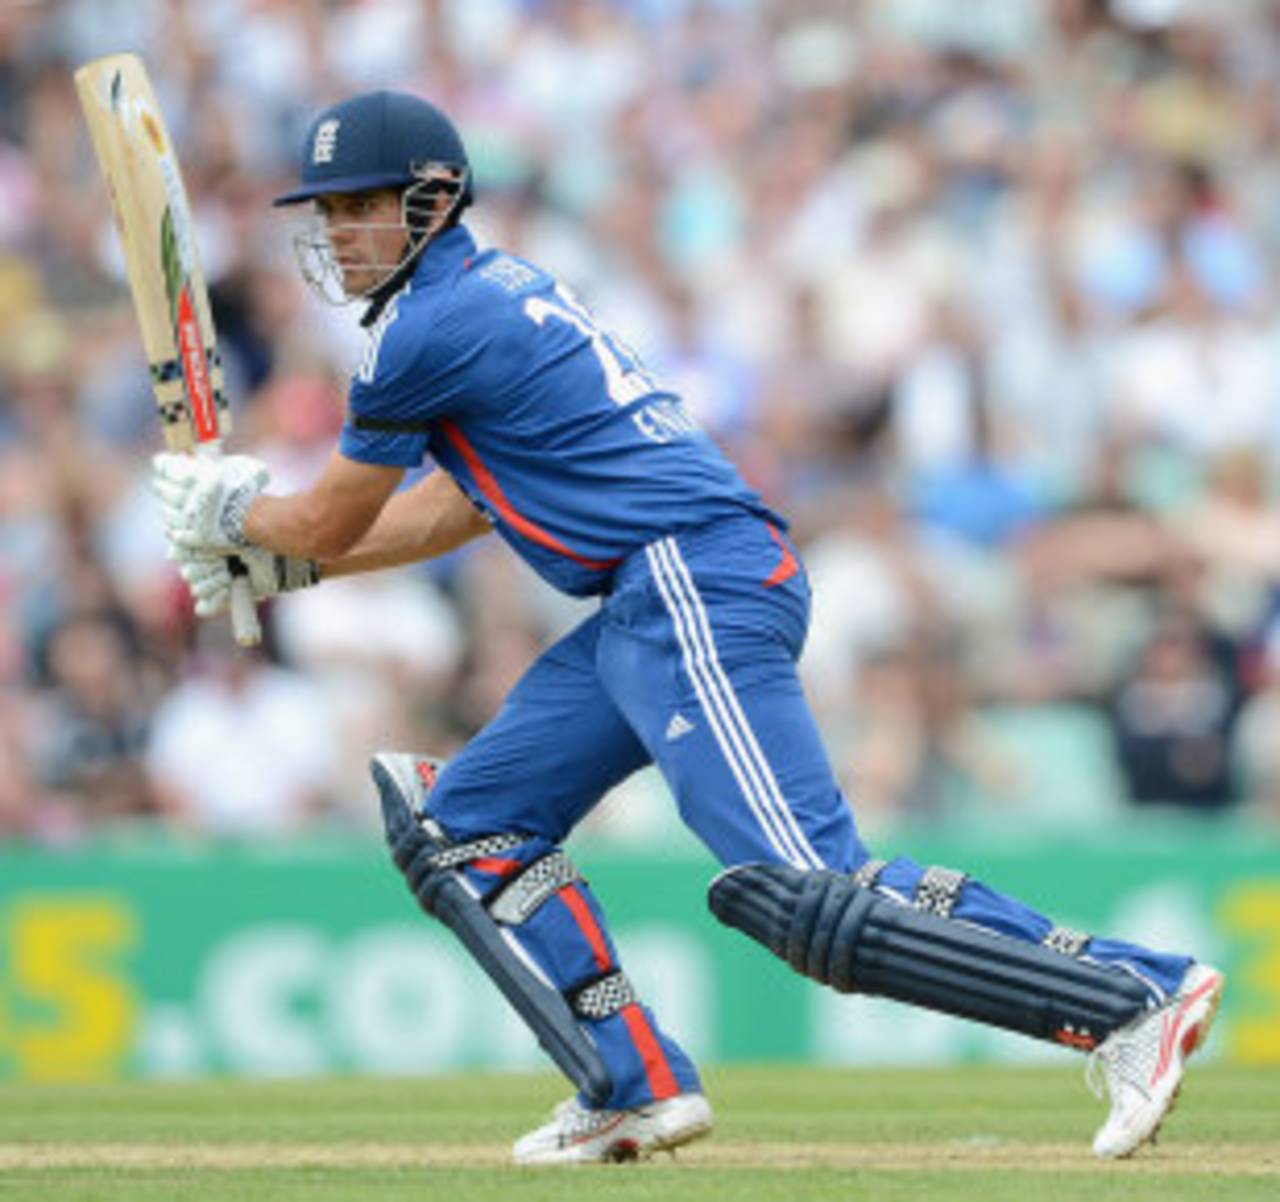
Hashim Amla is the only opener to average more than Alastair Cook in ODIs since the beginning of 2010 • Getty Images
At first glance, nothing about Alastair Cook suggests that he could be in for a great ODI career as an opening batsman. Though he has a reasonable range of strokes, Cook's forte has been his ability to bat long periods with unflagging concentration, a skill that doesn't count for much in 50-over cricket. In Test cricket, he scores his runs mostly through pushes and nudges - not the free-stroking batsman you'd want at the top of the order in a format that places a premium on quick scoring.
In the first three seasons of his ODI career, Cook's performances were in line with this analysis: his urgency at the start was well below par, especially in an age when openers are expected to make full use of the fielding restrictions. Splitting his 47-match ODI career into two halves, in the first 23 he scored at a strike rate of less than 70. His average of 30.52 during this period was reasonable, but at the end of 2008, England's selectors decided that Cook didn't fit into their ODI plans: from the beginning of 2009 till the middle of 2011, Cook played only three of England's 56 ODIs, as they tried as many as nine other openers alongside Andrew Strauss during this period. Only two of them - Ravi Bopara and Craig Kieswetter - played more than ten innings each, but neither made the job his own. Bopara's stats were very similar to Cook's - an average of 29.45 and a strike rate of 69.97 - while Kieswetter was more aggressive, but inconsistent. During this period, Cook played three games in Bangladesh in 2010 and did well, averaging 52 at a strike rate of 90. However, he then missed out on the ODIs at home that season and in Australia, and the World Cup in 2010-11.
Since his return to ODI cricket in 2011, though, Cook has been an absolute revelation, scoring six fifties and four centuries in 21 innings; clearly, his outstanding Test form has given him the confidence to play more freely in ODIs too. Overall, in 24 innings, including the tour to Bangladesh in 2010, he has averaged more than 54 at a strike rate of 91.47, a far cry from his stats in his previous 23 innings.
| Period | Matches | Runs | Average | Strike rate | 100s/ 50s |
| Till Dec 2008 | 23 | 702 | 30.52 | 68.15 | 1/ 3 |
| Jan 2010 onwards | 24 | 1191 | 54.13 | 91.47 | 4/ 8 |
| Career | 47 | 1893 | 42.06 | 81.17 | 5/ 11 |
One key difference between Cook the ODI batsman in these two phases has been his ability to play fewer dot balls over the last couple of years. It's true that his boundary percentage has also increased - and all four of his ODI sixes have been struck in his last 24 matches - but the bigger difference has been the decrease in dot balls. From a very high 62.52% in his first 23 innings, it has gone down to less than 50%. Some of it, admittedly, is also because he has survived the Powerplay overs more often in the last two years - batting in the middle overs has obviously allowed him to rotate strike more freely and reduce his dot-ball percentage.
| Period | Runs/ Balls | Run rate | 4s/ 6s | Boundary % | Dot-ball % |
| Till Dec 2008 | 702/ 1030 | 4.08 | 77/ 0 | 43.87 | 62.52 |
| Jan 2010 onwards | 1191/ 1302 | 5.48 | 134/ 4 | 47.02 | 49.00 |
You'd think that batting against spin might have been his bigger problem in his early days, but fast bowlers had far more success against him during his first couple of years. Before December 2008, he was dismissed 20 times by fast or medium-fast bowlers, and his run rate against them was only 3.99. Since 2010, his stats against pace have improved dramatically.
| Period | Pace-dismissals | Average | Run rate | Spin-dismissals | Average | Run rate |
| Till Dec 2008 | 20 | 30.15 | 3.99 | 2 | 49.50 | 4.75 |
| Jan 2010 onwards | 11 | 62.63 | 5.68 | 10 | 50.20 | 5.23 |
Cook's remarkable numbers mean he is easily among the best ODI openers going around today. Among batsmen who have opened the innings at least 20 times since the beginning of 2010, Cook's average has been bettered only by one - South Africa's Hashim Amla. Amla and Cook are the only openers to average more than 50 during this period. The fact that nine of the ten openers in the list below have a strike rate of more than 88 also indicates how high the benchmarks have been raised for openers. Cook has risen to the challenge, and all these runs will only add to his confidence in future matches.
| Batsman | ODIs | Runs | Average | Strike rate | 100s/ 50s |
| Hashim Amla | 35 | 2033 | 61.60 | 95.67 | 8/ 12 |
| Alastair Cook | 24 | 1191 | 54.13 | 91.47 | 4/ 8 |
| Gautam Gambhir | 25 | 1132 | 49.21 | 89.91 | 3/ 6 |
| Andrew Strauss | 28 | 1319 | 47.10 | 93.28 | 3/ 9 |
| Sachin Tendulkar | 23 | 1032 | 46.90 | 92.30 | 4/ 3 |
| Shane Watson | 49 | 2046 | 44.47 | 97.15 | 2/ 16 |
| Paul Stirling | 30 | 1290 | 43.00 | 99.53 | 4/ 5 |
| Virender Sehwag | 29 | 1156 | 41.28 | 116.53 | 3/ 2 |
| Martin Guptill | 32 | 1144 | 40.85 | 82.48 | 1/ 9 |
| Tillakaratne Dilshan | 70 | 2613 | 40.82 | 88.93 | 8/ 10 |
Apart from Cook, Strauss has also contributed mightily at the top of the order in the last two and a half years, averaging 47.10 at a strike rate of more than 93 in 28 innings. (Click here for a look at England's openers during this period.) More recently, Kevin Pietersen and Ian Bell have shone in that position as well, ensuring that at least one England opener has scored a century in the last six ODIs.
Since 2010, England's openers have averaged almost 43 runs per dismissal, and more than 47 runs per partnership - both of these are the second-highest among all teams. South Africa's openers have a slightly higher average, but a lower average stand, while Sri Lanka's average partnership is higher, despite a lower average for their openers. In the last year, England's openers have had even more incredible numbers - they average 51.32, with seven hundreds in 44 innings. New Zealand's openers have a higher average, but that's almost entirely due to high scores against Zimbabwe.
| Team | ODIs | Average | Strike rate | 100s/ 50s | Ave stand | 100/ 50 stands |
| South Africa | 39 | 43.28 | 87.51 | 9/ 17 | 42.38 | 1/ 16 |
| England | 53 | 42.92 | 92.51 | 11/ 27 | 47.67 | 7/ 13 |
| Sri Lanka | 74 | 40.04 | 84.01 | 15/ 26 | 49.95 | 10/ 15 |
| Australia | 66 | 36.85 | 84.99 | 5/ 32 | 42.29 | 7/ 15 |
| India | 72 | 35.15 | 88.54 | 10/ 19 | 34.04 | 3/ 16 |
| New Zealand | 44 | 32.65 | 84.73 | 4/ 16 | 39.20 | 4/ 7 |
| Pakistan | 64 | 32.63 | 74.41 | 7/ 24 | 39.68 | 6/ 11 |
| West Indies | 52 | 30.88 | 76.65 | 4/ 19 | 35.20 | 3/ 10 |
| Bangladesh | 51 | 30.10 | 75.00 | 2/ 23 | 28.23 | 1/ 9 |
| Zimbabwe | 40 | 26.52 | 70.73 | 3/ 12 | 25.70 | 3/ 5 |
All these runs in the last couple of years mean Cook's average is third-highest among the 25 England batsmen who have scored more than 1500 ODI runs. Jonathan Trott leads the list, while Pietersen, who has already retired from the format, is marginally ahead of Cook (42.51 to Cook's 42.06). Given Cook's outstanding run, though, it's very likely that he'll move even higher on that list pretty soon.
S Rajesh is stats editor of ESPNcricinfo. Follow him on Twitter