New Zealand's ODI struggles
The team's one-day form has slipped alarmingly of late, and most of the responsibility for these results lies with the batsmen
S Rajesh
22-Oct-2010
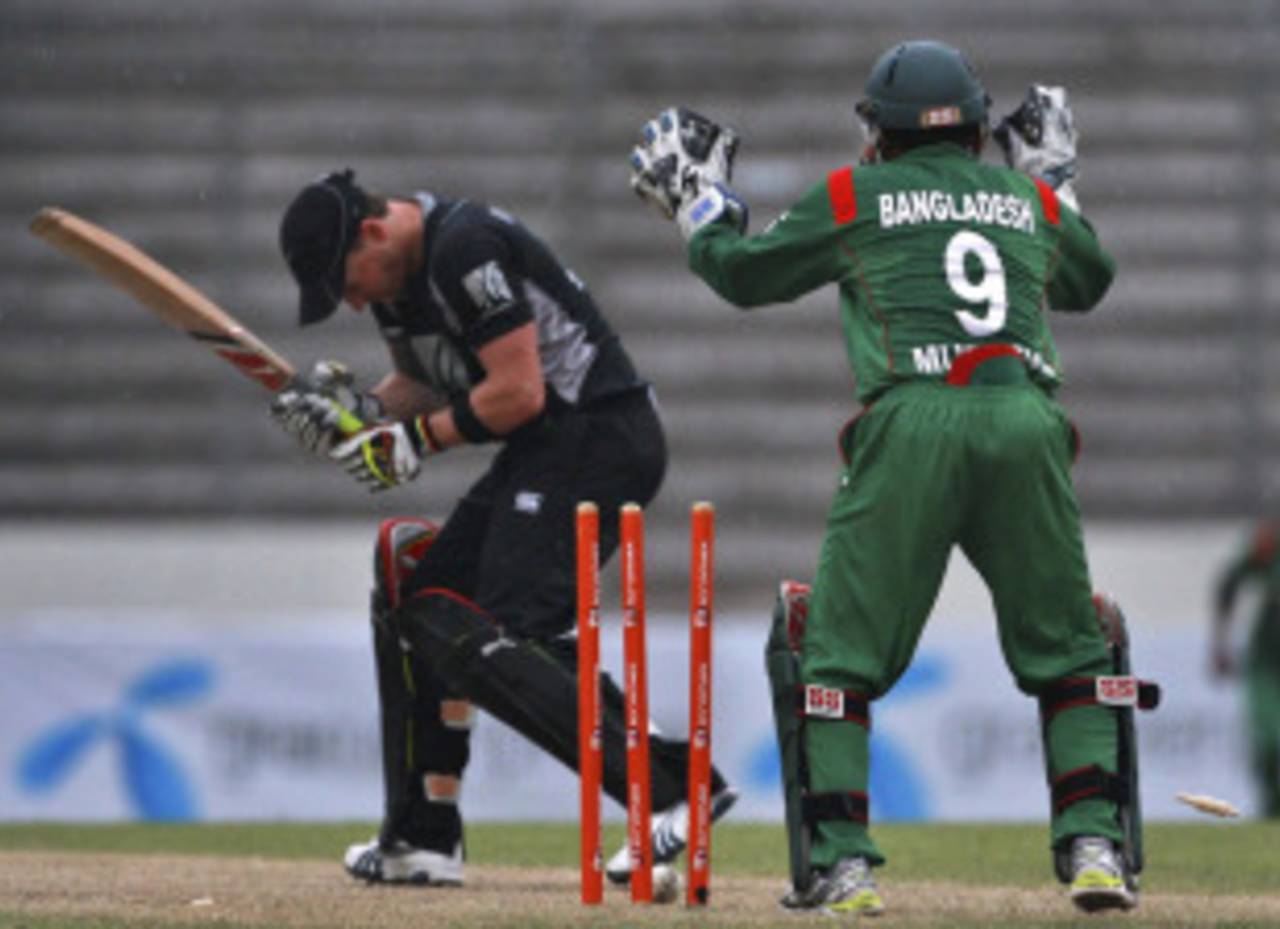
Brendon McCullum is one of the New Zealand batsmen who need to lift their game • Associated Press
There used to be a time, not so long ago, when New Zealand were used to pushing the best teams in the world, especially in one-day internationals. Their biggest attribute used to be their ability to punch above their strength. In the last couple of years, though, the team appears decidedly lightweight, and the 4-0 drubbing in Bangladesh starkly reflects this slide. Apart from Daniel Vettori, who continues to do an outstanding job with the ball, there is little to recommend the team, which has slipped in the rankings to eighth in Tests and seventh in ODIs.
Since the beginning of 2009, New Zealand have won only 16 out of 40 ODIs (excluding matches against the non-Test-playing teams). Their win-loss ratio has diminished to 0.80, which is nearly half the number they achieved in the previous three years (2006 to 2008). In those three years New Zealand clearly belonged in the elite category - only Australia and South Africa had a higher win-loss ratio. In contrast, they're now at No. 6 in terms of that ratio, and have won three of their last 12 completed matches.
In complete contrast, Bangladesh have improved their numbers hugely, with nine wins in 25 games, including a victory against England in Bristol, apart from the drubbing of New Zealand and a weakened West Indies. That's helped them trade places with West Indies, who've been abysmal during this period, while England's stats indicate why many reckon they're legitimate contenders for the 2011 World Cup.
| Team | 2009-10 - ODIs | W/ L | Ratio | 2006-08 - ODIs | W/ L | Ratio |
| Australia | 59 | 36/ 20 | 1.80 | 78 | 54/ 20 | 2.70 |
| South Africa | 24 | 15/ 9 | 1.66 | 59 | 34/ 23 | 1.47 |
| India | 51 | 29/ 18 | 1.61 | 92 | 48/ 38 | 1.26 |
| England | 37 | 21/ 16 | 1.31 | 70 | 25/ 41 | 0.60 |
| Sri Lanka | 42 | 22/ 18 | 1.22 | 81 | 38/ 37 | 1.02 |
| New Zealand | 40 | 16/ 20 | 0.80 | 58 | 31/ 22 | 1.40 |
| Bangladesh | 25 | 9/ 16 | 0.56 | 45 | 4/ 41 | 0.09 |
| Pakistan | 33 | 11/ 22 | 0.50 | 56 | 29/ 24 | 1.20 |
| West Indies | 31 | 4/ 24 | 0.16 | 57 | 19/ 36 | 0.52 |
Coming back to New Zealand, what has clearly hurt them during this period has been their inconsistency with the bat. In terms of batting run rate, five teams have done better than New Zealand, whose average runs per wicket is also considerably lower than the top teams. While the batsmen have struggled, the bowlers have consistently contributed more than their share: they're the only bowling unit with an economy rate of less than five runs per over during this period. That, unfortunately, hasn't been enough to compensate for the limp displays of the batsmen.
| Team | Bat ave | Run rate | Bowl ave | Econ rate |
| India | 38.21 | 5.72 | 33.25 | 5.55 |
| South Africa | 37.30 | 5.63 | 31.72 | 5.47 |
| Sri Lanka | 33.00 | 5.33 | 32.12 | 5.28 |
| Australia | 36.76 | 5.21 | 28.11 | 5.04 |
| England | 31.62 | 5.20 | 30.85 | 5.17 |
| New Zealand | 26.97 | 5.13 | 30.39 | 4.98 |
| West Indies | 25.58 | 5.11 | 36.25 | 5.44 |
| Pakistan | 26.24 | 4.91 | 32.02 | 5.03 |
| Bangladesh | 27.59 | 4.79 | 36.21 | 5.43 |
Since the beginning of 2009 only two New Zealand batsmen have scored more than 1000 ODI runs, which is an indication of the health of their line-up. Kane Williamson's 108 against Bangladesh during their recent series was only the fifth hundred by a New Zealand batsman during this period. India played 11 matches more than New Zealand, and scored 15 more centuries, while Australia and Sri Lanka both managed almost three times as many hundreds as New Zealand's batsmen.
Ross Taylor, Brendon McCullum and Martin Guptill have been played in the top four for New Zealand, but among them they've managed two hundreds in 104 innings. Taylor has been their leading batsman with 1169 runs, but he hasn't converted even one of his 11 scores of 50-plus into hundreds. McCullum has scored one century, but an average of less than 30 as an opener suggests a tendency to take too many risks.
| Batsman | ODIs | Runs | Average | Strike rate | 100s/ 50s |
| Ross Taylor | 39 | 1169 | 35.42 | 79.25 | 0/ 11 |
| Brendon McCullum | 36 | 1018 | 29.08 | 83.85 | 1/ 5 |
| Martin Guptill | 33 | 959 | 33.06 | 82.38 | 1/ 7 |
| Grant Elliott | 28 | 608 | 33.77 | 70.04 | 1/ 3 |
| Daniel Vettori | 33 | 523 | 27.52 | 88.94 | 0/ 1 |
Unlike in the last two years, during the period between 2006 and 2008, New Zealand had three batsmen who averaged more than 40. Jacob Oram was a huge factor down the order, averaging in the mid-40s at a strike rate of almost a run a ball. Scott Styris, meanwhile, played the steadying hand in the middle overs, which New Zealand have been lacking recently.
| Batsman | ODIs | Runs | Average | Strike rate | 100s/ 50s |
| Brendon McCullum | 58 | 1318 | 29.95 | 99.09 | 0/ 8 |
| Scott Styris | 43 | 1280 | 41.29 | 78.09 | 1/ 9 |
| Ross Taylor | 46 | 1112 | 31.77 | 79.65 | 3/ 3 |
| Peter Fulton | 39 | 1026 | 32.06 | 71.79 | 1/ 6 |
| Stephen Fleming | 31 | 923 | 32.96 | 74.55 | 2/ 6 |
| Jacob Oram | 36 | 897 | 44.85 | 96.86 | 1/ 8 |
| Jamie How | 28 | 845 | 35.20 | 71.00 | 1/ 6 |
| Lou Vincent | 24 | 637 | 27.69 | 75.11 | 1/ 4 |
| Nathan Astle | 18 | 632 | 42.13 | 78.80 | 1/ 4 |
What's even more worrying for New Zealand, though, is that they have performed so abysmally in the subcontinent only a few months before they are due to travel again to the region for the World Cup. To those who've followed the New Zealand team in the subcontinent over the last decade, this limp display should come as no surprise: since 2000, they've been among the worst batting teams in the subcontinent, with much poorer numbers than the other top teams. In fact, their average of 20.76 is poorer than those of Zimbabwe and Bangladesh, while their strike rate is only marginally better. Williamson's century was only their ninth in 60 games in the subcontinent; Australia, on the other hand, have 14 from 52, while South Africa have 13 from 55.
With stats like these it's hardly surprising that New Zealand lost an away series in Bangladesh.
| Team | Matches | Runs | Average | Strike rate | 100s/ 50s |
| Australia | 52 | 11,496 | 35.70 | 80.49 | 14/ 71 |
| India | 205 | 45,672 | 33.14 | 83.05 | 63/ 255 |
| Pakistan | 169 | 37,832 | 31.79 | 80.21 | 47/ 208 |
| South Africa | 55 | 11,196 | 31.36 | 74.79 | 13/ 65 |
| Sri Lanka | 175 | 35,873 | 29.30 | 76.70 | 43/ 183 |
| West Indies | 48 | 9839 | 29.10 | 75.88 | 17/ 51 |
| England | 45 | 9012 | 24.96 | 74.14 | 6/ 48 |
| Bangladesh | 119 | 20,937 | 21.71 | 65.21 | 10/ 101 |
| Zimbabwe | 62 | 11,178 | 21.41 | 64.99 | 6/ 57 |
| New Zealand | 60 | 10,465 | 20.76 | 66.15 | 9/ 43 |
The worry for New Zealand also is that their batsmen haven't only struggled against spin in the subcontinent. You'd expect them to have a tough time against the slow bowlers in conditions they're not used to, but even the fast bowlers have given New Zealand's batsmen plenty of grief. In all ODIs since January 2002 (that's the period for which Cricinfo has complete ball-by-ball data), New Zealand's batsmen have averaged 28.02 against spin in the subcontinent, and 19.57 against pace. Their run rates have been equally abysmal against pace and spin.
In the series in Bangladesh, New Zealand averaged 18.89 (run rate 3.65) against spin and 20.55 (run rate 4.20) against pace. Luckily for New Zealand's batsmen, India's top bowlers will probably give the ODI series between the two teams a miss, to prepare for the Test series in South Africa. New Zealand's best chance would be to get some runs against India's second-rung bowling attack and then carry that confidence forward into the World Cup.
| Team | Spin - average | Run rate | Pace - average | Run rate |
| India | 42.62 | 5.08 | 36.46 | 5.11 |
| Australia | 41.48 | 4.33 | 39.17 | 5.30 |
| West Indies | 42.34 | 4.60 | 32.28 | 4.68 |
| Pakistan | 39.76 | 4.96 | 34.92 | 4.85 |
| Sri Lanka | 37.06 | 4.51 | 29.72 | 4.67 |
| South Africa | 36.18 | 4.35 | 31.87 | 4.67 |
| England | 30.17 | 4.48 | 26.55 | 4.65 |
| New Zealand | 28.02 | 4.01 | 19.57 | 3.87 |
| Bangladesh | 26.23 | 3.90 | 21.66 | 3.85 |
S Rajesh is stats editor of Cricinfo