Mahela revisited, and the king of draws
Mahela Jayawardene's superb form over the last three years, and India's tendency to draw Test matches
S Rajesh
14-Dec-2007
|
|
|
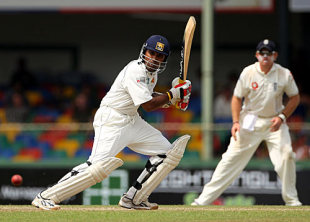
Kumar Sangakkara's stunning batting display in the last year has taken the spotlight off another Sri Lankan batsman whose performances have been only slightly less spectacular. For a while now, critics have been raving about Mahela Jayawardene's skill and silken elegance, even naming him Aravinda de Silva's successor in the line-up, and of late those claims haven't seemed so far-fetched.
Jayawardene's talent was never in doubt, but for a long time he struggled to come to terms with the fact that a top-class Test batsman needs to do more than just contribute pleasing cameos and soft runs against lesser opposition. The table below splits his career into two parts, and while the average in his first 65 Tests was a more-than-respectable 48, more than two-thirds of those runs had come at home, as also ten of his 12 hundreds. The other worrying aspect was his inability to convert starts - of his 34 fifty-plus scores, only 12 were centuries.
In the last three years, though, Jayawardene has gradually begun to blossom. The average has gone up, but more strikingly, the conversion-rate has improved dramatically. In the 27 Tests he has played since January 2005, Jayawardene has translated eight of his 16 fifty-plus scores into hundreds; in fact, seven of his last eight fifty-plus scores have been hundreds.
| Period | Runs | Average | 100s/ 50s |
|---|---|---|---|
| First 65 Tests | 4738 | 48.34 | 12/ 22 |
| Last 27 Tests | 2320 | 55.23 | 8/ 8 |
A Numbers Game column in July 2004 had highlighted his tendency to get out after getting a start: in a two-year period from July 2002, he had fallen 18 times out of 27 between scores of 15 and 70, which is hardly what you'd want from your leading batsman. In the last three years, though, the percentages look significantly better: only 33% of the time has he lost his wicket in that range.
| Range | No. of scores | % of total innings |
|---|---|---|
| 0-14 | 18 | 42.86 |
| 15-70 | 14 | 33.33 |
| 71 and above | 10 | 23.81 |
The ability to convert starts has also made Jayawardene one of the top eight Test batsmen over the last three years, in terms of averages. And apart from Shivnarine Chanderpaul, all the batsmen in the list have excellent conversion-rates.
| Batsman | Tests | Runs | Average | 100s/ 50s |
|---|---|---|---|---|
| Michael Hussey | 18 | 1896 | 86.18 | 7/ 8 |
| Ricky Ponting | 28 | 3062 | 74.68 | 13/ 12 |
| Mohammad Yousuf | 24 | 2773 | 71.10 | 11/ 7 |
| Kumar Sangakkara | 26 | 2586 | 69.89 | 9/ 6 |
| Jacques Kallis | 27 | 2756 | 68.90 | 11/ 12 |
| Younis Khan | 27 | 2829 | 60.19 | 9/ 10 |
| Mahela Jayawardene | 27 | 2320 | 55.23 | 8/ 8 |
| Shivnarine Chanderpaul | 24 | 1990 | 53.78 | 5/ 11 |
Jayawardene has also turned in a few superb performances overseas - his 119 at Lord's was outstanding, as was his 104 in Hobart earlier this year, but he still hasn't turned it around completely. Though his overseas average is nudging 40 over the last three years, it's still far below his home average. He has also struggled for consistency abroad - juxtapose his eight fifty-plus scores with six ducks in 25 innings, and you get the picture.
| Tests | Runs | Average | 100s/ 50s/ 0s | |
|---|---|---|---|---|
| Home | 13 | 1372 | 76.22 | 5/ 3/ 0 |
| Away | 14 | 948 | 39.50 | 3/ 5/ 6 |
What's encouraging, though, is that captaincy hasn't detracted from his batting - he averages more than 60 when leading the team. The next few years will prove if he can sustain that performance against all opposition, and in all conditions.
Masters of the draw
Test matches have become far more result oriented over the last few years than they used to be, but that theory doesn't seem to hold true for India. For the second time in succession, a three-Test series involving India produced just one decisive result - their tour of England earlier this year had ended 1-0 in their favour as well. Rewind a bit further, and you'll find that three of India's four Tests in the West Indies in 2006, and two out of three in Pakistan earlier that year, had finished in stalemates as well.
Test matches have become far more result oriented over the last few years than they used to be, but that theory doesn't seem to hold true for India. For the second time in succession, a three-Test series involving India produced just one decisive result - their tour of England earlier this year had ended 1-0 in their favour as well. Rewind a bit further, and you'll find that three of India's four Tests in the West Indies in 2006, and two out of three in Pakistan earlier that year, had finished in stalemates as well.
It hasn't all been the team's fault, though: the tracks in Lahore and Faisalabad, as well as some in the West Indies, were such that even the Australians might have struggled to force a result. A few games ended agonisingly close to producing one - India should have won in Antigua and Bangalore, and lost at Lord's - but overall, they have undoubtedly been the kings of the draw in the last couple of years: in the last 21 Tests they've played, 11 - that's more than 50% - haven't produced a decisive result. In fact, the last time a three-Test series not involving India produced two or more draws was four years ago, when Sri Lanka won a home series against England 1-0. The only other such instance since 2001 has been New Zealand's tour of Australia, when all three Tests were drawn.
The table below lists teams in order of the highest percentage of draws they've played out in the last two years, and it's difficult to miss the fact that the next series will pit the two teams at either end of the list.
| Team | Tests | W-L-D | Draw % | Bat - Runs/ wkt | Bowl - Runs/ wkt |
|---|---|---|---|---|---|
| India | 21 | 6-4-11 | 52 | 40.05 | 34.99 |
| West Indies | 14 | 0-8-6 | 42 | 29.92 | 43.01 |
| Pakistan | 20 | 5-7-8 | 40 | 38.03 | 40.10 |
| England | 24 | 8-9-7 | 29 | 35.40 | 36.05 |
| New Zealand | 10 | 3-5-2 | 20 | 25.32 | 30.48 |
| Sri Lanka | 18 | 10-5-3 | 17 | 37.53 | 30.24 |
| Bangladesh | 9 | 0-8-1 | 11 | 21.71 | 62.09 |
| South Africa | 19 | 9-8-2 | 10 | 32.59 | 31.14 |
| Australia | 13 | 13-0-0 | 0 | 53.49 | 27.66 |
S Rajesh is stats editor of Cricinfo.