Which are the most bowler-friendly Test venues? And which ones have favoured batsmen most heavily?
Using the Pitch Quality Index, we measure the true nature of a Test pitch
Anantha Narayanan
20-Apr-2019
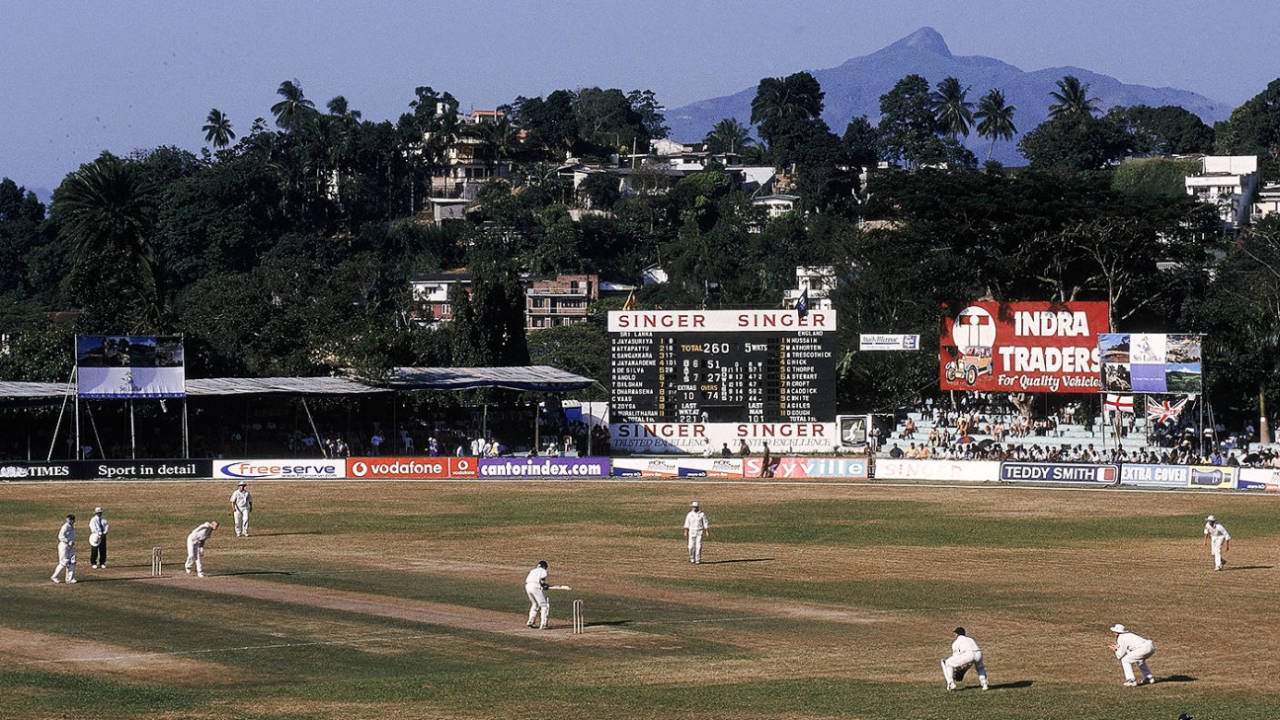
Welcome, bowlers: Kandy's old ground, the Asgiriya, heavily favoured bowlers, even though the Pitch Quality Index improved as the match went on • Getty Images
In the mid-19th century, there was a terrifying roundarm bowler from Nottinghamshire named John Jackson, a giant who scaled 15 stone in his socks. It was said he was faster than Harold Larwood.
It is certain that on the rough turf of the heyday of the round-arm attack, they would appreciate the emotions of the poor cricketer named Ludd, who was struck on the foot by John Jackson. And when the umpire announced "Not out!", Ludd said "Mebbe not, but I'm a-going". - Neville Cardus in English Cricket (1945)
***
Imagine an overcast June morning at Headingley well before the millennium. The English captain has put the visiting team in. The four-man pace attack is waiting for the kill. What can the batting team aim for? Two hundred would be a good score.
Let us now travel down south-east a few thousand kilometres to Lahore in the 1980s. Despite the presence of a strong local bowling group, led by Imran Khan, there was a two-thirds chance that a match played there would end in a draw.
Move south another couple of thousand kilometres to the beautiful hill region of Kandy in Sri Lanka, and the fourth day of a Test at Asgiriya. After three middling innings scores, the visiting team is set 200 to win. A trio of smiling assassins, masquerading as spinners, is waiting to have a go. A noted bookmaker offers odds of 25-1 against a batting win.
Go westward, to the Caribbean, to Georgetown in Guyana or to St John's in Antigua. It does not matter who wins the toss, who bats or who bowls: 500-plus will be met by 500-plus. The bowlers might as well go on a strike.
The study of Test grounds is a fascinating one. Thirty years ago, when I started work on my first cricket simulation program, I set a Ground Index value of 1 for Headingley and Asgiriya and 5 for Bourda in Georgetown. That rating holds good even today, despite the fact that my database then was an infinitesimal part of what I have today. In 1988, I went by the Test results and computed RpW (runs per wicket) values.
Today, I will dive into this fascinating area of analysis using the PQI (Pitch Quality Index) metric, one of my most powerful and solid derived measures. The PQI indicates the true nature of the pitch. Because the expected performances of the players is built in, PQI allows for normalisation across players at the ends of the spectrum, which means Bradman and Bashar won't be dumped in the same basket, and neither will Barnes and Boje.
First, a short primer on PQI.
The PQI is dependent on five values: the runs expected from the batsmen (based on Career-To-Date-Location averages), actual runs scored by the batsmen, wickets expected from the bowlers (based on CTD-Location averages), actual wickets taken by the bowlers, and the actual runs scored per wicket.
To start with, the following ratios are determined.
- Actual runs to expected runs
- Actual wickets to expected wickets
- Actual RpW to Average RpW
- Actual wickets to expected wickets
- Actual RpW to Average RpW
Each of these ratios falls in the range of 0 to 3.0. The sum of the ratios, which is the first-level PQI, has a range of 0.0 to 9.0. However, since the median of this distribution is around 3.0, it is mapped to a 100-based PQI. A raw PQI of 3.0 maps to 50.0. A low PQI indicates a bowler-friendly pitch and a high PQI indicates a batting pitch.
In the last 142 years, the highest and lowest PQI values are 93.4 (India v New Zealand, Delhi, 1955-56 - 450 for 2, 531 for 7 and 112 for 1) and 14.1 (Australia v South Africa, Melbourne, 1931-32 - 36, 153 and 45). In addition to the match PQI, over the past few months I have developed PQI values for the first and second halves of each match.
My analysis covers all 2351 Tests played, across three periods: 1877-1949, 1950-1989 and 1990-2019. These periods have been selected after careful consideration of all relevant aspects. I'll be looking at the average match PQI; the change from the PQI for the first half, PQI 1/2 to that for the second half, PQI 3/4; and finally the result percentages.
In order to show ground names on graphs properly, I have used the following names on the graphs. The accompanying text in parentheses refers to the more well-known ground names.
Manchester (Old Trafford)
Nottingham (Trent Bridge)
Leeds (Headingley)
PSS (P Saravanamuttu Stadium - Colombo)
SSC (Sinhalese Sports Club - Colombo)
Nottingham (Trent Bridge)
Leeds (Headingley)
PSS (P Saravanamuttu Stadium - Colombo)
SSC (Sinhalese Sports Club - Colombo)
First, let me look at the complete set of Tests from the average match PQI point of view. The criterion for selection is that a minimum of 20 Tests should have been played at the particular ground. Only then do the average PQI values have some relevance. And I will not consider Tests in which fewer than 80 overs (approximately one day's play) were bowled and fewer than five wickets were taken. Eleven such Tests are excluded.
As expected, Asgiriya Stadium, Kandy was the most bowler-friendly ground in the history of Test cricket. The average PQI for this ground, in the 21 Tests played between 1983 and 2007, was a mere 43.6. Just to give an example, the Sri Lanka-England Test in November 2018 at the SSC, with a match PQI of 42.3, had scores of 336, 240, 230 and 284. The low PQI also means that the result percentage is high. More about that later.
The ground in Port Elizabeth, the Wanderers and the Old Wanderers had average PQI values around 45-47. Everyone knows that these are tough grounds to play on. In between them comes the Wankhede Stadium with a comparable PQI value. The third and fourth innings at the Wankhede were really tough to handle; more often than not, the spinners ruled the roost. Headingley also comes in around here, with an average PQI of 47.6. However, this is over a large number of Tests.
At the other end of the spectrum, we have St John's, which clocks in at 59.0. A comparable Test is the 1991 Ashes match in Adelaide, which had a match-PQI of 59.1, with scores of 386, 229, 314 for 6 and 335 for 5. It is no wonder that 12 of 22 Tests were drawn at St John's.
Bourda in Georgetown has an overall PQI of 56.7. Kanpur, Adelaide and Bulawayo have average PQI values exceeding 55.0. There is no surprise at seeing any of these grounds so far to the right in this graph.
The overall mean PQI value is around 51. Many grounds fall into the middle area - PQI of between 48 and 54. This includes the four most famous grounds ever. Only these top grounds are identified on the graph. The others are just listed. There was no space to list four other grounds - Centurion (24 Tests), Bangalore (23), PSS (21) and Mirpur (20).
Now let's move on to analysis by period.
The first period spans 72 years, between the very first Test to the last one played in 1949, so it covers the careers of Don Bradman, Sydney Barnes, Jack Hobbs, Wally Hammond, Harold Larwood and Clarrie Grimmett. The cut-off is a minimum of ten Tests per ground.
Only the Old Wanderers and Newlands fall into the bowler-centric domain. Headingley and Sydney are on the border. And only one ground, Adelaide, had an average match-PQI as high as 58.0. The other grounds were in the middle. How does one explain this congregation of grounds in the middle? Analysing result percentage during these years is a futile exercise since many Tests were played to a finish.
My take is that the Barnes- and George Lohmann-driven bowler-centric early Tests (say, until 1920) were almost totally compensated for by the Bradman- and Hammond-driven batsman-centric inter-war years. This conclusion is confirmed by analysis. However, I cannot really split the period further since the number of Tests played is quite low.
Now, for the period 1950-1989. One could call this the era of Sobers, May, Chappell, Gavaskar, Lillee, Holding, Bedi. Careful batting and wanting to avoid losses were the mantra during the first two decades of this period. But the style of play became more attacking in the latter two. The cut-off here is 15 Tests.
Only Headingley falls into the bowler-centric area, with an average PQI of around 46. Lord's just about manages to stay left of the line dividing the bowler-friendly zone from the neutral one. However, it is clear that batsmen dominated this period. This is proved by the number of grounds that appear in the batsman-centric group: no fewer than six, all but one of which are from India and the West Indies.
The graph above refers to the current period: 1990 to 2019. As we will see later, this is a result-oriented period. The cut-off here is 20 Tests.
Two grounds each from South Africa and the West Indies are in the bowler-centric area. From the time they were admitted back into international cricket, South Africa have turned out pitches that produce results. Their own bowling strength gave them the encouragement to do so. For West Indies, the 1990s were still a good period, with stalwarts like Curtly Ambrose and Courtney Walsh leading the attack.
Sydney has been the most batsman-friendly track of the past 30 years. It is possible that the seemingly spinner-friendly tracks at the SCG ensured that first-innings scores were consistently above par. That may be the case with Bulawayo also, because of the general lack of bowling strength of Zimbabwe.
In the next lot of graphs, I will use the newly developed PQI 1/2 and PQI 3/4 figures to show you how the PQI values changed during matches. This includes both types of changes: grounds in which the PQI deteriorated (more likely) as matches went on, and grounds in which it improved. The PQI values used are the averages across all matches.
Over the years, the Wankhede has deteriorated the most. Teams were better off trying to score runs there in the first innings: the average PQI went down 35% from 51.1 to 34.1. It's clear that this was caused by the wearing of the pitch and the spinners ruling the roost. Bulawayo moved from 57 to 43. It is possible that many of the high first-innings scores would have been by visiting teams and the low second-innings ones those of the weaker Zimbabwe sides. The other five grounds in the first group are all in the subcontinent, indicating clearly the influence of wear of the pitch and of spinners controlling the match in the latter stages.
In Hamilton, the PQI 1/2 was almost exactly equal to the PQI 3/4 - a terrific symmetry, across 25 Tests.
There were only three grounds in which the PQI improved as the match went along. Perth, Old Wanderers, and surprisingly, Kandy. The first two are good grounds that are maintained very well and hold their shape for match days. But Kandy: how does it not deteriorate? From an inspection of the scores, I see two reasons. One is that there are quite a number of Tests in Kandy with innings scores that read like 249, 198, 325 for 5, 307 for 7. And the other is that there have been some huge innings wins - in the early stages, Sri Lanka were at the receiving end, and more recently, it has been their opponents who lost by big margins.
During the first 70 years of Test cricket, the two major English pitches deteriorated fast - understandable because of the weather and the uncovered surfaces. The Australian and South Australian pitches held firm and improved as matches went along. However, the greatest improvement came at Trent Bridge - of around 15%. At the SCG there were identical PQI figures in the first and second halves, across no fewer than 38 Tests.
In the middle period, Chepauk in Chennai deteriorated just over 30%. Enough for the spin quartet and other spinners to make hay while the southern sun shone. At three New Zealand grounds, the pitch deteriorated upwards of 15%. Adelaide maintained an almost perfect PQI through 29 Tests. At the other end, Lord's and Eden Gardens improved as the Test went on, which brings to mind the spring of 2001 when VVS Laxman and Rahul Dravid batted through the fourth day.
Now we come to the current period. I have already talked about Bulawayo; Mirpur might be a similar case. In the early stages there were a few innings losses for Bangladesh. It's interesting to note that at some famous grounds, like the MCG, Adelaide and The Oval, the second-innings PQI in recent times has dropped quite significantly. We have already seen Hamilton's almost identical brace of PQI values. Only in two grounds in the southern hemisphere do we see a significant improvement of the PQI values as the match progressed.
My third analysis is a BCG Chart that looks at the two key values - PQI and Result %.
The overall result percentage is around 67. Note the very high result percentages (80-plus) in Kandy and Port Elizabeth, and high result percentages at the Wankhede, Old Wanderers and Headingley. Understandably, these are grounds with low average PQI values. At the other end of the spectrum, note the low result percentages (sub-45) of Lahore, Kanpur, Antigua and Georgetown. As expected, the average PQI values of these grounds are rather high. Lahore has had 20 draws in the 35 Tests played there, while Antigua has had 12 draws out of 22 Tests.
However, I am intrigued by the possible exceptions that can be clearly identified on the chart. There are grounds that have a high result percentage but with surprisingly high PQI values - Adelaide, the WACA and Brisbane. However, we should not be fooled by the high result percentage of a ground like Adelaide, which no doubt owes partly to the fact that most early Tests played there were timeless and were played to a finish.
On the other hand, there are grounds like Bangalore, Karachi and Old Trafford that do not have very high result percentages and also have somewhat low PQI values. This is very intriguing indeed. With Old Trafford, there might be a valid reason: the significant loss of playing time because of weather. Is that the case with Lord's also? Maybe one day I should do an analysis of the time lost to weather interruptions.
An interesting and amazing coincidence: Trent Bridge and Chepauk have totally identical result percentages and PQI match values - 64.5% and 51.0. On the graph, the grey circle with a white one overlaid indicates that there are two grounds with exactly the same values.
In the first period, Adelaide stands out. It was a high-scoring, result-oriented ground. Seventeen out of 18 Tests played there ended in results. The SCG was even better - 37 results out of 38. The MCG was up there too - 36 results out of 39. But let us not forget about the timeless Tests at these grounds.
At the other end of the spectrum, we have Old Trafford - only ten Tests out of 26 ending decisively, and Headingley (nine out of 16). And let us not forget that both these grounds had relatively low PQI values. The average result percentage during this period was a high 70%, not much of a surprise.
The second period was a dull one. The overall result percentage was only around 57%. The grounds that shone like beacons were the WACA and the Gabba, which had result percentages above 70%. Headingley had a terrific value of 77%; there were 28 decisive Tests out of 36 played there. Both the SCG and the MCG had high result percentages. Those two and Headingley had relatively low PQI values. Kanpur had the worst record, followed by Lahore and Georgetown. Only five out of 16 Tests played in Kanpur ended decisively. All three grounds had high PQI values. Despite low PQI values, Karachi and Eden Gardens did not produce many results. It's interesting to note that Adelaide had a string of six consecutive draws in the 1980s.
Finally, we come to the present era. The overall result percentage was an amazing 74%. Old Trafford continues to lead the table for Tests without non-draw results. However, with 13 results out of 21, the result percentage is a reasonable 62%. Zimbabwe playing for draws means that Bulawayo is also around that mark. Kingsmead, Trent Bridge and Hamilton have 72% results, but the low PQI values ought to have produced more results. The SCG matches this result value but at a much higher PQI. Headingley leads the table, with 88% results. The years either side of the millennium were golden ones, producing 15 consecutive results in Kingston, 13 in Centurion, and 16 at the MCG. Adelaide and The Oval are comfortable wickets for batsmen (PQI above 54) but also produce a high level of results.
***
From next month, I will move on to the ODI scene. My next three articles are briefly outlined below.
- The long-awaited ODI Performance Analysis - for both bowlers and batsmen (May)
- A look at World Cup matches that proved to be turning points for the ultimate champions. These are not necessarily the best matches nor the most exciting ones. The Cricket Monthly has done an excellent job chronicling those. I will look at the matches that turned the tide, so to speak, for the winners (June)
- A performance review of the World Cup 2019 (July)
Readers can comment on this article here. Note that this link takes you outside ESPNcricinfo, and ESPNcricinfo does not monitor, publish, or otherwise associate itself with comments posted there.
Anantha Narayanan has written for ESPNcricinfo and CastrolCricket and worked with a number of companies on their cricket performance ratings-related systems