Who's the better ODI batsman: Richards or Tendulkar or Kohli?
An analysis of the leading batsmen in each period of ODI history, and an overall comparison
Anantha Narayanan
11-Apr-2020
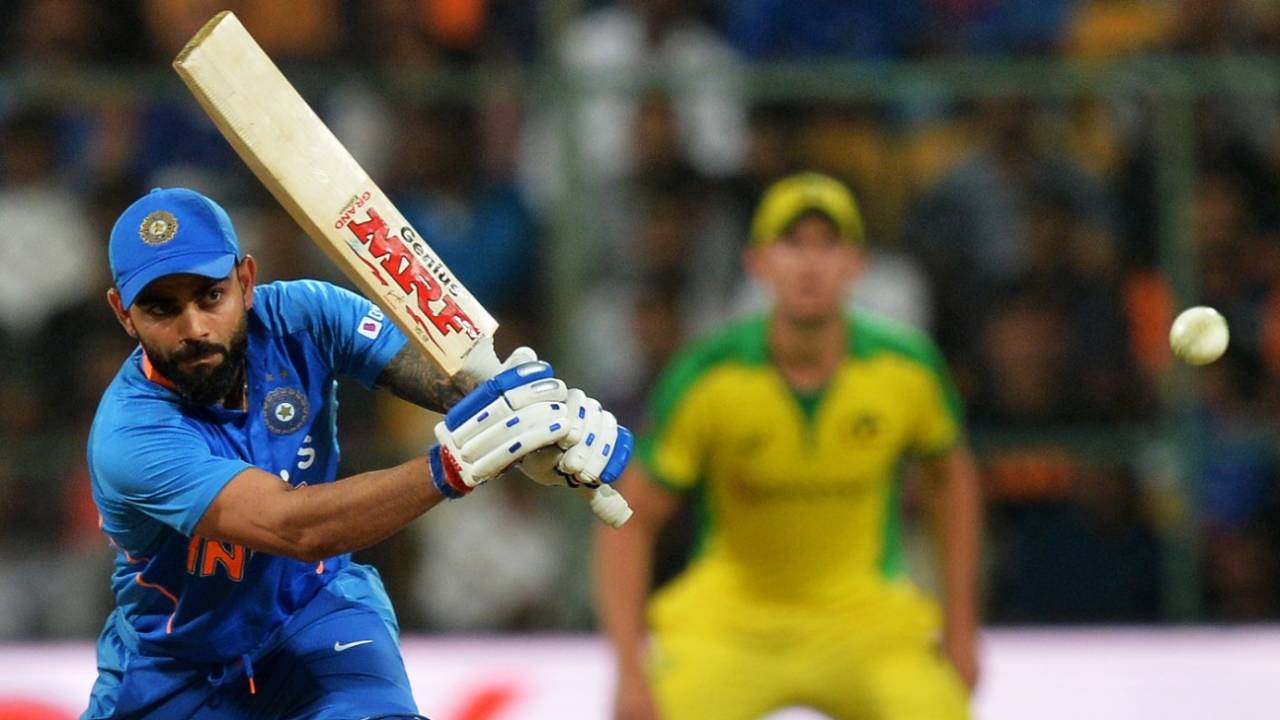
Viv Richards remains the 50-overs king, but Virat Kohli could possibly match his numbers in the future • AFP
First things first: please take extra care in these times of difficulty, distress and uncertainty. All our prayers should focus on emerging from these coming months of global crisis relatively unscathed. Sport will resume when things near normalcy. In the meantime I hope I can keep you all occupied with some historical analyses like I see other wonderful ESPNcricinfo columnists and analysts doing.
Recently a pair of articles by me were published analysing the performances of Test players across the 144-year history of the format. I split this long period into six shorter periods and presented the best batsmen and bowlers in each period. I received quite a few emails suggesting I should do a similar exercise for ODIs.
This year is the 50th year of the format, so it seems to be a good time for that exercise. The ODI game also allows a fine-tuning of the whole exercise because of the presence of two distinct parameters for batsmen (runs scored and strike rate) and bowlers (wickets and economy). Since complete data is available for all 4255 ODI matches, I can accurately normalise, making comparisons across periods viable. The difficult question "How good was Viv Richards?" can be answered, given we will be comparing normalised data.
Period selection
The periods have been selected with some World Cup years as endpoints.
The periods have been selected with some World Cup years as endpoints.
Period 1: 1971-1987 (4 WCs) - 482 matches
Period 2: 1988-1996 (2 WCs) - 672 matches
Period 3: 1997-2003 (2 WCs) - 920 matches
Period 4: 2004-2011 (2 WCs) - 1150 matches
Period 5: 2012-2020 (2 WCs) - 1031 matches
Period 2: 1988-1996 (2 WCs) - 672 matches
Period 3: 1997-2003 (2 WCs) - 920 matches
Period 4: 2004-2011 (2 WCs) - 1150 matches
Period 5: 2012-2020 (2 WCs) - 1031 matches
Weighted Batting Average
The batting average is a seriously flawed metric, though it has stood for long. It does not present the true picture of a batsman's ability, and players cannot really be compared on their averages, even within the same playing era. I have developed a sound alternative called the Weighted Batting Average (WBA). Please click here for more on it.
The batting average is a seriously flawed metric, though it has stood for long. It does not present the true picture of a batsman's ability, and players cannot really be compared on their averages, even within the same playing era. I have developed a sound alternative called the Weighted Batting Average (WBA). Please click here for more on it.
ODI Batting Index
Who is the perfect ODI batsman? The WBA reflects the runs the batsman scores per (weighted) innings and the strike rate reflects the rate at which he scores these runs, and it is essential to consider both measures. Neither Geoff Marsh nor Shahid Afridi come anywhere near fitting the bill; one crawls and the other is like a meteor. We need a batsman who has a WBA figure of over 50 and a strike rate exceeding 100. We have batsmen approaching, but not necessarily going past, these numbers, so it is clear that we need a composite index that encompasses both.
Who is the perfect ODI batsman? The WBA reflects the runs the batsman scores per (weighted) innings and the strike rate reflects the rate at which he scores these runs, and it is essential to consider both measures. Neither Geoff Marsh nor Shahid Afridi come anywhere near fitting the bill; one crawls and the other is like a meteor. We need a batsman who has a WBA figure of over 50 and a strike rate exceeding 100. We have batsmen approaching, but not necessarily going past, these numbers, so it is clear that we need a composite index that encompasses both.
Some years back when I looked at this topic first, I tried the simplistic "multiplication" method. My first batting index was simply a product of the batting average and SR (per ball). I began losing confidence in this metric when it produced some odd placements. The cumulative effect played havoc with the numbers, given the average was high for players like Michael Bevan and the strike rate similarly so for players like Afridi.
A few years later, I tweaked the index. I started with a base formula: Index = Average + 0.50 * SR (per 100 balls). This looked all right but needed refinement. A couple of years back, I decided not to work with batting average and to only use the WBA thereafter. The WBA is lower than the batting average. After a series of trials and comparing with overall mean, median and standard-deviation values of WBA and SR distributions, I worked out that 0.50 was too high a multiplier for the SR. After many testing exercises, I arrived at the multiplying factor of 0.425. The current formula is: Batting Index (BIN) = WBA + 0.425 * SR (per 100 balls).
Now let us look at some actual numbers. How does a player reach the magic BIN value of 100? A WBA of 50, combined with an SR of 110 will get him a BIN value of nearly 100. AB de Villiers nearly got to 100 during the 2012-20 period. Let us play out various combinations: 50 + 100 gets us to 92.5; 45 + 90 work out to 83.25; 35 + 120 end at 86.0; 50 + 80 gives us 84.0; 45 + 75 gets us 76.88. A BIN value of 90.0 is out of the world, 80 is outstanding, 75 is top drawer, 70 is very good, and so on.
Let us move on to the first set of graphs that relate to the five periods. For period one, the cut-off is a minimum of 2000 runs scored. For period two, it is 2500 runs. For the last three periods, the cut-off is 3000 runs. All the values shown are unadjusted since all the players in each group played in that specific period and all the values are comparable to each other.
Viv Richards was (is and will always be) the king. At a time when the average strike rate was 67.1, he scored at 90-plus. His WBA was way ahead of anyone else's during the period. It is no wonder that, based on these unadjusted values, his BIN is over 84. With these numbers, he would have topped the table during the next three periods as well. The only thing left is to do what Sheldon Cottrell does: stand and salute.
Zaheer Abbas has an excellent WBA, supported by a very good strike rate. His BIN of 79.5 is indicative of how good a batsman he was. Gordon Greenidge had a pedestrian strike rate but made up with a good WBA. However, he was more than ten index points behind Abbas. Graham Gooch was very competent. Kapil Dev made up for his low WBA with an excellent strike rate of 104.7, the best in the first three periods.
The second period was led by Brian Lara, with a very good WBA of 41.6 and a reasonable strike rate of 77. The BIN is just short of 75. This only shows how good Richards was. This was the initial phase of Sachin Tendulkar's career. His WBA was well below 40 but he scored at a strike rate well above 80. Saeed Anwar had similar figures, but a lower WBA. Aravinda de Silva had a very good strike rate of nearly 85, but a sub-par WBA. It's surprising to see the strike rate of Dean Jones was below 70 in this period.
Tendulkar was just edged out by Lara in the 1988-1996 period. This time he made the top position his own by a wide margin. An excellent WBA of 44 with a strike rate of nearly 90 meant that his BIN was around 82 - taking him into the realms of great performers. Sanath Jayasuriya had an average WBA value but more than compensated with an outstanding 90-plus strike rate. Adam Gilchrist's BIN was almost identical to Jayasuriya's - a slightly lower WBA value made up for by a slightly higher strike rate. Ricky Ponting was quite close behind, and Chris Gayle completes the top five.
The first decade of the new millennium brought its first 100-plus strike-rate values, years after Kapil Dev first achieved that landmark. The three players with 100-plus strike-rate values are at the top of the BIN rankings. Virender Sehwag, with a reasonable WBA of 35 and an excellent strike rate of 109 is at the top with 81.8 points - a truly great performance. Gilchrist is marginally behind in both measures but breaches the 80-mark. Afridi's WBA of 22 is more than made up by the all-time-high strike rate of 136. It must be noted that he just about made the cut-off.
Compared with what he achieved in the next period, de Villiers could only be termed good here. However, his 40-plus WBA and 90-plus strike rate are enough to get him to fourth position. Tendulkar comes in at No. 5, giving him the unique distinction of being in the top five in three of these periods. That is some achievement and makes us wonder about the level of consistency and quality this wonderful batsman exhibited. His BIN was above 78.
It can be seen that de Villiers has had the best period of any ODI batsman ever. Let us remember that these are unadjusted values. His WBA of more than 50 and strike rate of more than 110 have given him a near-100 BIN value. Just savour these figures: scoring over 50 every single time he went in to bat, and in 45 balls at that. It is difficult to even begin to describe de Villiers' achievement. And look at who he has pushed into second place - Virat Kohli, who has been nearly as outstanding during this period: a WBA value of nearly 55, at a strike rate of 96, giving him a BIN value of over 96. Only de Villiers could have kept Kohli away from first place, and so he did Rohit Sharma is in third place with a BIN value of just over 88. He suffers only in comparison with the two great batsmen ahead of him. Jason Roy's fourth place might surprise some. However, a 40-plus WBA, delivered at a strike rate of 107-plus, is not to be ignored. No one would be surprised at David Warner's fifth-place ranking. He has an excellent WBA of more than 46 and a near-100 strike rate.
Adjustment of ODI batting values
As seen above, the ODI span has been split into five periods. The key values are summarised by period and I arrived at the adjustment factors by comparing the overall mean values across all 4255 matches. Three methods of adjustment were considered:
As seen above, the ODI span has been split into five periods. The key values are summarised by period and I arrived at the adjustment factors by comparing the overall mean values across all 4255 matches. Three methods of adjustment were considered:
1. Peer adjustment: The batsman values are adjusted by the batting adjustment factor of the concerned period. In other words, if the period was a high-scoring one, the batsman's WBA values are adjusted downwards. If it was a period with low strike-rate values, the strike-rate values are adjusted upwards. And so on.
2. Bowling quality - All: The batsman values are adjusted by the bowling adjustment factor of the concerned period. In other words, if the bowling was very good and the BpW (balls per wicket) values were low, the batsman's WBA values are adjusted upwards. If it was a period with high Bowler ER values, indicating a freer-scoring period, the strike-rate values are adjusted downwards. And so on.
3. Bowling quality - Others: This is the same as the second point above, with one major difference. In determining the bowling-quality values for the period, the values of the batsman's own team's bowlers will be excluded. In other words, Richards would not get the benefit of his own team's high-quality bowlers, like Joel Garner, Malcolm Marshall and Michael Holding. Ponting would not get the benefit of the bowling quality of Glenn McGrath, Shane Warne nd Brett Lee. Otherwise, the calculations are the same.
It is clear that the third option is the best one. It takes into account the quality of the bowling while excluding bowlers from the batsman's own team. Also, for the purposes of the adjustment, the batsman's WBA is split into BpWI (Balls per Weighted Innings) and SR (Runs per Ball). The adjustment factors are equal to the ratio of the all-ODIs value by the period value. The BpWI is adjusted by the Bowlers' BpW adjustment factor and the SR is adjusted by the ER adjustment factor. Then weighted values are taken to arrive at the final adjusted WBA and SR.
In order to have proper batsmen-oriented values, only the stats for Nos. 1-7 in a batting line-up have been considered while determining the summary values. Care is taken to exclude cases such as Javagal Srinath going in to pinch-hit. The No. 8 batsman is evaluated carefully.
The period-wise adjustment values are provided below.
| Period | Mats | Balls | Runs | Wkts | Inns | WtedInns | BpW | BpW Adj | ER | ER Adj |
|---|---|---|---|---|---|---|---|---|---|---|
| 1971-1987 | 482 | 260138 | 174441 | 5824 | 6227 | 6053 | 44.7 | 0.925 | 0.671 | 1.170 |
| 1988-1996 | 672 | 365363 | 262608 | 8134 | 8795 | 8552 | 44.9 | 0.920 | 0.719 | 1.092 |
| 1997-2003 | 920 | 492342 | 379007 | 11663 | 11989 | 11715 | 42.2 | 0.979 | 0.770 | 1.019 |
| 2004-2011 | 1150 | 597550 | 485382 | 14997 | 14952 | 14608 | 39.8 | 1.037 | 0.812 | 0.966 |
| 2012-2020 | 1031 | 535668 | 465153 | 13857 | 13372 | 13079 | 38.7 | 1.069 | 0.868 | 0.904 |
| . | ||||||||||
| All ODIs | 4255 | 2251061 | 1766591 | 54475 | 55335 | 54007 | 41.3 | 1.000 | 0.785 | 1.000 |
The BpW values have steadily come down over the years, from 44.7 to 38.7. So the earlier periods were slightly easier to bat longer in, and the corresponding values are adjusted downwards for those periods. For the latter periods, those values are adjusted upwards. The ER values have steadily increased over the years, from 0.671 to 0.868. In the earlier periods it was difficult to score quickly and the batting values are adjusted upwards. It was easier to score in the latter periods, so the batting values are adjusted downwards.
To give an example of how the complex adjustment is made, I have given below two examples.
Viv Richards
During the 1971-1987 period, Richards played 122.9 weighted innings (139 conventional innings). He scored 5629 runs in 6233 balls. His BpWI was 50.7. The team-excluded BpW adjustment factor for this period was 0.905. (Without excluding the West Indies bowlers, it was 0.925.) This brought his BpWI down to 45.9. His SR was 90.3. The team-excluded ER adjustment factor for this period was 1.156. (For all teams, it was 1.170.) This brought his SR up to 104.4. The WBA for this period, which was 45.79 without any adjustment, was moved up to 47.88.
During the 1971-1987 period, Richards played 122.9 weighted innings (139 conventional innings). He scored 5629 runs in 6233 balls. His BpWI was 50.7. The team-excluded BpW adjustment factor for this period was 0.905. (Without excluding the West Indies bowlers, it was 0.925.) This brought his BpWI down to 45.9. His SR was 90.3. The team-excluded ER adjustment factor for this period was 1.156. (For all teams, it was 1.170.) This brought his SR up to 104.4. The WBA for this period, which was 45.79 without any adjustment, was moved up to 47.88.
During the 1988-1996 period, Richards suffered a steep loss of form, which eventually led to his retirement. The corresponding numbers are 40.3 weighted inns (48 innings), 1092 runs, 1218 balls. The BpWI of 30.2 was brought down by 0.912 to 27.6. The SR of 89.7 was moved up by 1.090 to 97.7. The unadjusted WBA for this period was 27.11, which was moved down to 26.94.
The period values were further weighted by the balls faced and runs scored in each period, and the career WBA was determined to be 44.29 (unadjusted value 41.18). The career SR was adjusted to 103.3 (unadjusted value 90.2).
Virat Kohli
During the 2004-2011 period, Kohli played 69.5 weighted innings (74 conventional innings). He scored 2860 runs in 3407 balls. His BpWI was 49.0. The India-excluded BpW adjustment factor for this period was 1.037. (Without excluding India, it was 1.069.) This brought his BpWI up to 50.8. His SR was 83.9. The India-excluded ER adjustment factor for this period was 0.970. (Without excluding India it was 0.904.) This brought his SR down to 81.4. The unadjusted WBA for this period was 41.15, which was moved up to 41.39.
During the 2004-2011 period, Kohli played 69.5 weighted innings (74 conventional innings). He scored 2860 runs in 3407 balls. His BpWI was 49.0. The India-excluded BpW adjustment factor for this period was 1.037. (Without excluding India, it was 1.069.) This brought his BpWI up to 50.8. His SR was 83.9. The India-excluded ER adjustment factor for this period was 0.970. (Without excluding India it was 0.904.) This brought his SR down to 81.4. The unadjusted WBA for this period was 41.15, which was moved up to 41.39.
In the 2012-2020 period, Kohli hit the ceiling. The corresponding numbers are 163.9 (165 innings), 9007 runs, 9319 balls. The BpWI of 56.8 was moved up by 1.064 to 60.5. The SR of 96.7 was moved down by 0.902 to 87.2. The WBA for this period was 54.92, which was moved down to 52.73.
The period values were further weighted by the balls faced and runs scored and the career WBA was determined to be 49.67 (Unadjusted value 50.82). The SR was adjusted to be 85.8 (unadjusted value 93.3).
Lots of numbers and explanations, but quite logical and easy to follow if anyone sets their mind to it. The key factors to understand are the period values, adjustment factors, and the significance of these.
Let us move to the second set of graphs. These cover the adjusted values across all periods.
In the domain of the WBA, Kohli stands supreme. This, despite the fact that his career WBA of 50.82 has been adjusted downwards by around 2.3%. Remember that this is WBA and not the batting average, which stands at 59.33 for Kohli. There is no doubt that Kohli deserves this honour. His frequency of 5.6 innings per 100 is way ahead of the next best batsman. His conversion rate is 42.6%, again the highest for qualifying batsmen. All these have contributed to his lofty position.
Hashim Amla is in second position, about four runs behind Kohli. This indicates the valuable role Amla played for South Africa. A sub-par run of ten matches at the end of his career made him decide to quit while still very good and among the best around. A value of 45-plus is not to be ignored.
We have already seen de Villiers' magnificent form in the earlier tables. He is just behind Amla, and with a magnificent strike rate of more than 100.
Then comes Richards. What does one say of him? A true giant indeed. Rohit Sharma's top-five place should not surprise anyone. He has been extraordinarily consistent during the past few years in the 50-over format.
Shahid Afridi - a player extraordinaire. Who cares at what age he made his debut - 16 or 20? What he achieved over the next 19 years is unbelievable. Over 8000 runs at the adjusted SR of 118. How many matches did he miss due to flimsy reasons? He could easily have crossed 10,000 runs.
The SR of Richards, which was 90-plus during a period of mean and very effective bowlers, has been adjusted up to 103. Richards and de Villiers are the only players in the top five of both tables, the adjusted batting average and adjusted strike rate. de Villiers has his career SR of 101 adjusted down to 95.
In third and fourth places are two giant strikers of the ball - Sehwag and Gilchrist. When one thinks of great strikers, these names come to the fore. Gilchrist has almost no adjustment done to his career SR of 97 and Sehwag's comes down from 104 to 102. Sehwag, Afridi and Richards are the only batsmen with career SR values exceeding 100.
In terms of raw SR, Glenn Maxwell, with 123.4, and Jos Buttler, with 119.8, are ahead of Afridi. However, they did not qualify for this table as they have not achieved the cut-off of 4000 ODI runs.
The graph above is not a portrayal of the top ODI batsmen of all time. It may look like that but it is actually a collection of ODI batsmen with the highest BIN values. It so happens that the top batsmen in this list are all-time greats, but to arrive at the best ODI batsmen of all time, we need a lot more data and lot of context, represented by the following:
- Career runs scored
- World Cup achievements
- Key match performances
- Man-of-the-Match awards
- Contribution to team causes
- Rating values for the innings, so as to bring in context, and so on
- World Cup achievements
- Key match performances
- Man-of-the-Match awards
- Contribution to team causes
- Rating values for the innings, so as to bring in context, and so on
The adjusted WBA of Richards is 44.3 and this high value, combined with his adjusted SR value of 103.3, has given him a very high adjusted career value of 88.2. In this particular analysis, reaching 90 would be virtually impossible since a batsman has to have numbers like 44 and 110, or 50 and 90. Richards stands very tall indeed. It is clear that in any analysis seeking to arrive at the best ODI batsman of all time, irrespective of the algorithms used and independent of the parameters considered, Richards will be a serious contender.
Kohli was simply magnificent during the past decade, barring the last few matches. His strength is the extraordinary WBA of nearly 50 and a very good SR of 85. Based on these numbers, what are the chances of him reaching Richards' level? I think the WBA limit has been reached. It will be very difficult to go past 50. However, Kohli could get his SR to 90 and then he would be at par with Richards.
Might de Villiers make a comeback to the South African ODI team to improve his already outstanding figures of 44-plus and 95? Very unlikely. He might come back for the World T20, if and when it is conducted, but the next ODI World Cup is too far off. And he may not be in great form, even if he did return.
What can one say of Tendulkar? Let us not forget that he achieved a 43-plus WBA and SR of 89 across 463 matches, 18,426 runs and 21,326 balls. Those will count in the final reckoning. He was in the top-five list across three periods. His consistency across 24 years was amazing. His ODI retirement was much better than the Test exit, the laboured 100th international hundred against Bangladesh notwithstanding. It is also true, though, that the last few matches of Richards and Ponting were very poor.
Email me with your comments and I will respond. This email id is to be used only for sending in comments.
Anantha Narayanan has written for ESPNcricinfo and CastrolCricket and worked with a number of companies on their cricket performance ratings-related systems