ODI boundary stats over the years
A look at the rate and percentage of boundaries struck in ODIs down the years
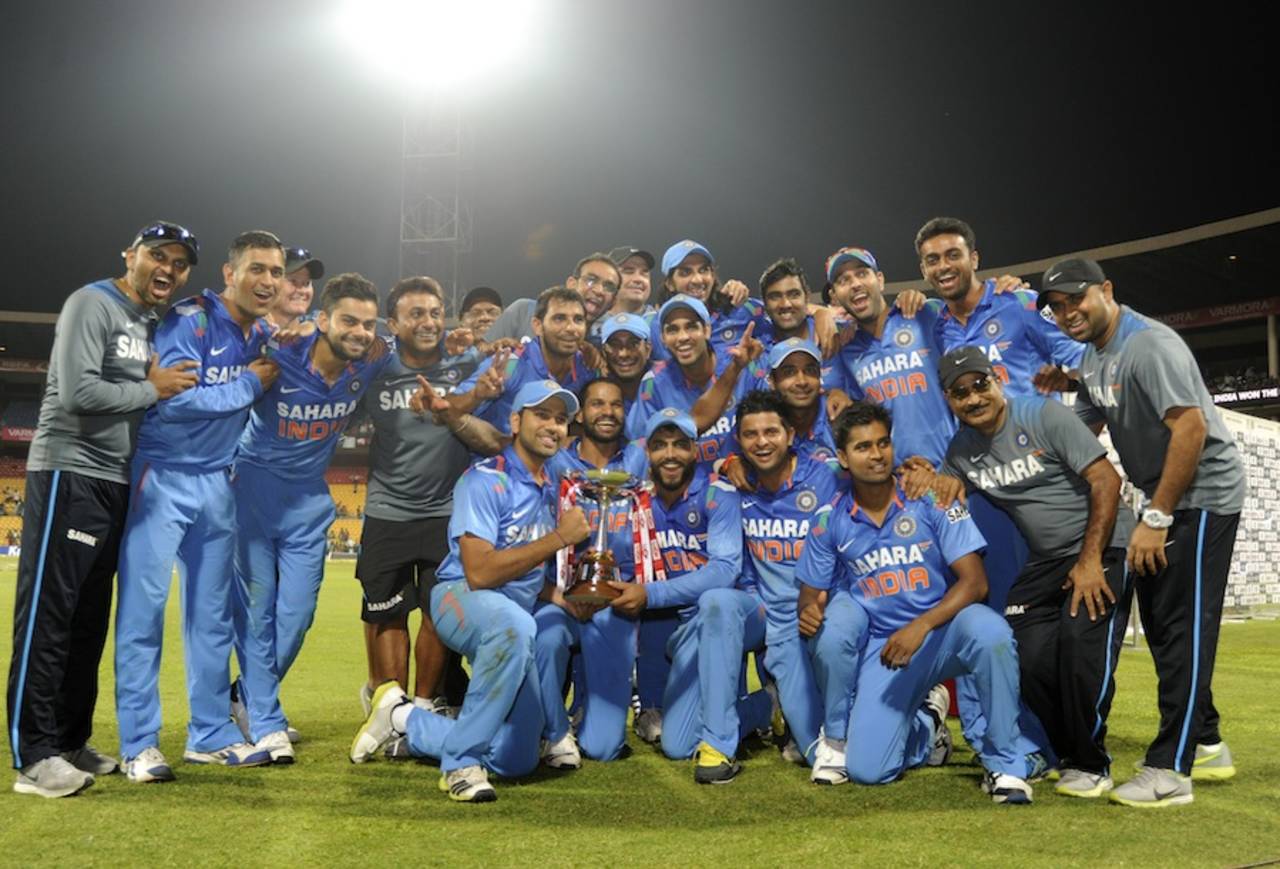
The India-Australia ODI in Bangalore in November 2013 saw 38 sixes hit - the most in an ODI • BCCI
Recently Jon Hotten wrote an article, "The declining value of the single", on the ODI game, the essence of which was that unlike earlier days, when singles were considered more important and won matches for teams, today the wins are more and more due to fours and sixes. His article was based on his observations of the game that were subjective in nature. I am going to extend that idea further. I will look at the way the scoring of runs through boundaries has changed over the years. Since we are yet to create our ball-by-ball database, I cannot do the singles analysis. But due to Milind's sterling efforts, I now have the boundary data for well over 99% of the matches. Let us see what can be derived.
Let me add a caveat here. This article in no way signifies my endorsement of what is happening in ODI cricket today. Whether the batsmen have all become superhuman, bowlers are bowling trash, rules favour only batsmen, rules are unfair, or grounds are small, what has happened in the India-Australia series is ridiculous. There were 11 innings played, nine exceeding 300 and three of these 300-plus scores were overhauled. There has been one really good bowling performance. This is neither cricket nor a contest. The matches are between two sets of batsmen, not between batsmen and bowlers. Matches like the ones in Jaipur and in Nagpur, for that matter the matches in New Zealand during 2002 when 150 was par, represent ODI cricket at its worst. A score of 250 should at least have a 33% chance of defending. Between a frowning batting captain who says, "Oh god, only 300!" and a smiling captain who says, "250, let us defend", I would prefer the later one. My tuppenny-worth, probably not worth a single penny.
These seemingly hot matches leave me cold. I think the Pakistan-South Africa matches are proper contests between the bat and the ball. Lots of South Africa wickets to start with, a stirring partnership for the ninth wicket, sound batting by Pakistan, and finally great attacking bowling and fielding by South Africa leading to a one-run win. The near-100 boundaries in Nagpur and Bangalore do not excite me as much as the 20 wickets in Sharjah and in Dubai do. If Australia had won by five runs in Nagpur, that would not change my view a whit. Or for that matter, if India had batted first, scored 350 runs and Australia had chased it down, I would not change my stance. If anyone thinks that nine 300-plus innings out of ten is great competitive cricket, they do not know what competitive cricket is. Finally, a question for readers to ponder over. Who do you think played the better innings: Wayne Parnell or George Bailey/Virat Kohli? If this question is put to vote, 5% would say Parnell, and I would be among those vociferous five.
A final cherry on the ice cream. The commendable, but by now expected, chase by Bangladesh of New Zealand's substantial 304. I rest my case, your honour. But what warms me on this wintry day is the ESPNcricinfo poll in which over 50% of the 64000 respondents have said that this is nonsense and espoused the bowlers' cause. Three simple changes will do. Nothing else is needed.
- No fielding restrictions of any kind after 15 overs. Why any restrictions? Let the batsmen improvise or beat the field.
- No Powerplay after 15 overs. The current system is quite nonsensical. Forced Powerplay in the 35th over in every match.
- Allow two bowlers to bowl 20% extra each: 12 overs. For that matter, limit any bowler to 25% and leave it at that.
Let four specialist bowlers bowl and encourage the teams to have 6+4+1 split. If that means the end of the bits-and-pieces cricketers, fine. If James Faulkner, Ravindra Jadeja, Mohammad Hafeez, Thisara Perera et al can complete their ten-plus overs, they get in. If not, they do not.
Having got that off my chest, let me now come to the analysis.
There is only one table to be perused. However I have presented the different facets of the analysis in the form of graphs. The table is presented below, with no comments since the graphs follow immediately. The period 1971 to 1979 is grouped together since very few matches were played during this period. Similarly the first three years of the 1980s decade are also grouped together. From 1983 onwards the years are shown separately. The featured table does not have all the columns in view of limitations in space. However the downloadable table contains all data columns.
| Year | ODIs | Total Runs | Fours | Sixes | 4s6s Runs | % of Total | Balls | % of 4-balls | % of 6-balls | % of 4/6-balls | 4s/ODI | 6s/ODI |
|---|---|---|---|---|---|---|---|---|---|---|---|---|
| 197x | 79 | 29725 | 2409 | 174 | 10680 | 35.9% | 45377 | 5.31% | 0.38% | 5.69% | 30.5 | 2.2 |
| 198x | 81 | 31357 | 2131 | 179 | 9598 | 30.6% | 43501 | 4.90% | 0.41% | 5.31% | 26.3 | 2.2 |
| 1983 | 66 | 26827 | 1985 | 215 | 9230 | 34.4% | 37464 | 5.30% | 0.57% | 5.87% | 30.1 | 3.3 |
| 1984 | 50 | 18020 | 1258 | 105 | 5662 | 31.4% | 25379 | 4.96% | 0.41% | 5.37% | 25.2 | 2.1 |
| 1985 | 64 | 24322 | 1650 | 171 | 7626 | 31.4% | 32716 | 5.04% | 0.52% | 5.57% | 25.8 | 2.7 |
| 1986 | 60 | 21884 | 1466 | 162 | 6836 | 31.2% | 31334 | 4.68% | 0.52% | 5.20% | 24.4 | 2.7 |
| 1987 | 73 | 31164 | 2111 | 262 | 10016 | 32.1% | 41090 | 5.14% | 0.64% | 5.78% | 28.9 | 3.6 |
| 1988 | 60 | 25132 | 1657 | 186 | 7744 | 30.8% | 33384 | 4.96% | 0.56% | 5.52% | 27.6 | 3.1 |
| 1989 | 54 | 22282 | 1435 | 174 | 6784 | 30.4% | 29660 | 4.84% | 0.59% | 5.42% | 26.6 | 3.2 |
| 1990 | 60 | 23697 | 1618 | 181 | 7558 | 31.9% | 31806 | 5.09% | 0.57% | 5.66% | 27.0 | 3.0 |
| 1991 | 39 | 16111 | 1082 | 93 | 4886 | 30.3% | 21778 | 4.97% | 0.43% | 5.40% | 27.7 | 2.4 |
| 1992 | 88 | 34432 | 2372 | 211 | 10754 | 31.2% | 47741 | 4.97% | 0.44% | 5.41% | 27.0 | 2.4 |
| 1993 | 82 | 31636 | 2196 | 205 | 10014 | 31.7% | 43446 | 5.05% | 0.47% | 5.53% | 26.8 | 2.5 |
| 1994 | 98 | 39997 | 2866 | 300 | 13264 | 33.2% | 53935 | 5.31% | 0.56% | 5.87% | 29.2 | 3.1 |
| 1995 | 60 | 25312 | 1812 | 220 | 8568 | 33.8% | 33251 | 5.45% | 0.66% | 6.11% | 30.2 | 3.7 |
| 1996 | 126 | 53501 | 3958 | 512 | 18904 | 35.3% | 69183 | 5.72% | 0.74% | 6.46% | 31.4 | 4.1 |
| 1997 | 113 | 48102 | 3550 | 432 | 16792 | 34.9% | 60947 | 5.82% | 0.71% | 6.53% | 31.4 | 3.8 |
| 1998 | 108 | 48558 | 3654 | 481 | 17502 | 36.0% | 59614 | 6.13% | 0.81% | 6.94% | 33.8 | 4.5 |
| 1999 | 154 | 64112 | 4979 | 709 | 24170 | 37.7% | 82544 | 6.03% | 0.86% | 6.89% | 32.3 | 4.6 |
| 2000 | 131 | 55589 | 4433 | 542 | 20984 | 37.7% | 71196 | 6.23% | 0.76% | 6.99% | 33.8 | 4.1 |
| 2001 | 120 | 51706 | 4207 | 503 | 19846 | 38.4% | 65688 | 6.40% | 0.77% | 7.17% | 35.1 | 4.2 |
| 2002 | 145 | 62854 | 5498 | 652 | 25904 | 41.2% | 76272 | 7.21% | 0.85% | 8.06% | 37.9 | 4.5 |
| 2003 | 147 | 58592 | 5082 | 626 | 24084 | 41.1% | 75236 | 6.75% | 0.83% | 7.59% | 34.6 | 4.3 |
| 2004 | 127 | 53328 | 4461 | 554 | 21168 | 39.7% | 65672 | 6.79% | 0.84% | 7.64% | 35.1 | 4.4 |
| 2005 | 107 | 48869 | 4312 | 582 | 20740 | 42.4% | 57423 | 7.51% | 1.01% | 8.52% | 40.3 | 5.4 |
| 2006 | 160 | 68361 | 6181 | 760 | 29284 | 42.8% | 84999 | 7.27% | 0.89% | 8.17% | 38.6 | 4.8 |
| 2007 | 190 | 82315 | 7135 | 1274 | 36184 | 44.0% | 97961 | 7.28% | 1.30% | 8.58% | 37.6 | 6.7 |
| 2008 | 125 | 51363 | 4350 | 708 | 21648 | 42.1% | 62382 | 6.97% | 1.13% | 8.11% | 34.8 | 5.7 |
| 2009 | 149 | 66152 | 5678 | 909 | 28166 | 42.6% | 77481 | 7.33% | 1.17% | 8.50% | 38.1 | 6.1 |
| 2010 | 142 | 62880 | 5219 | 820 | 25796 | 41.0% | 75668 | 6.90% | 1.08% | 7.98% | 36.8 | 5.8 |
| 2011 | 146 | 63797 | 5275 | 886 | 26416 | 41.4% | 75864 | 6.95% | 1.17% | 8.12% | 36.1 | 6.1 |
| 2012 | 90 | 39393 | 3172 | 542 | 15940 | 40.5% | 46714 | 6.79% | 1.16% | 7.95% | 35.2 | 6.0 |
| 2013 | 114 | 49368 | 4321 | 780 | 21964 | 44.5% | 58473 | 7.39% | 1.33% | 8.72% | 37.9 | 6.8 |
| Total | 3408 | 1430738 | 113513 | 15110 | 544712 | 38.1% | 1815179 | 6.25% | 0.83% | 7.09% | 33.3 | 4.4 |
Note: Out of the 3428 ODI matches played until November 2, 2013, fours and sixes data is not available for 14 matches, all played before 1997. No fours and sixes were hit in six matches.
The first graph displays how the percentage of runs scored in boundaries has varied over the years. Imagine a 100 with ten fours and two sixes: a typical innings. Fifty-two per cent of runs have been scored in boundaries. Thus it can be seen that 50% is a rather high figure. Because we are averaging across hundreds of matches, a figure of 40% is itself on the higher side. This is borne out by the all-ODIs value of 38.1%. During the early years this value stood at around 30%. The other 70% of runs were scored in singles, two and threes. These were the days when singles won matches. This figure remained below 35 until 1995 when the phenomenon of Sanath Jayasuriya and little Romesh Kaluwitharana took over. Note the sharp increase during the latter part of the 1990s decade, resulting in a huge value of 41% during 2002. This represented a 2.6% increase over the previous year. Barring a drop below 40% during 2004 (one wonders why), this figure has remained well above 40% over the past decade. This crossing past 44% was achieved over the past five batting contests in India. The highest, predictably, has been during the current year, with 44.5%. The year 2007 was also quite close to this figure. If the trend in ODI rules continue, the bats have a bit of lead embedded in the sweet spots and the boundaries keep on moving inward, I predict that the number 50% would be reached by 2020.
This graph analyses the boundary-hitting from the point of view of balls. The average across 41 years is just over 7%. This means that a boundary is scored every 14 balls. This was just over 5% during the early years and has now moved to well over 8%. The lowest value was 5.2% during 1986. This may very well be because West Indies played fewer matches during that year. The year 2002 was a huge jump and 8% was breached for the first time. This percentage value fell below 8 for a few years and it is not a surprise that 2013 has seen the highest value reached - 8.72%. This means that the frequency has moved from once every 19 balls to once every 12 balls. Note how similar the graphs are.
This is a dual graph plotting the fours of fours and sixes separately. This will let us get further insights on how the sixes' frequency has changed over the years. The overall frequency of fours is 6.25%, in other words once every 16 balls. This was below 5.0% during the initial years and is now at 7.39%, an increase of nearly 50%.
On the other hand, the sixes frequency changed more drastically. From a low of 0.38, to start with, we have now reached 1.33%. That is nearly four-fold increase in the frequency. In a 50-over match, during 1970s, two sixes were likely to be hit on an average. Now this has moved to well over six sixes. This probably explains what is happening.
The last graph indicates the average number of fours and sixes per match. We are talking of nearly 40 fours per match, on an average. And over six sixes per match. Note how some of the fours have become sixes recently. Incidentally the last India-Australia match single-handedly moved the sixes per match by 0.2. In that match, played in Bangalore, a six was hit every 15 balls!
In a later article I will try and look at how these figures have changed in specific geographical areas. The problem is that even if I look at four geographical areas - England, Asia, Australia and Africa, there are too many data elements if I look at the year-wise split. 33 x 4, to be precise. So I have to look at seven to eight periods rather than years. The other point is that Sri Lanka is not India. 300-300 is the order of the day-night in India. In Sri Lanka it is likely to be 200s. So I have to study the grouping carefully. I do not want Sri Lanka to dilute the India-Pakistan numbers. I may even combine England and Sri Lanka.
One final set of tables. These show the matches in which the number of boundaries exceeded 80 or number of sixes exceeded 20 or the percentage of runs scored off boundaries exceeded 60.
% of Boundary runs in match exceeding 60% of total
MtId Year FBt Scr Res SBt Scr 4s 6s Tot Runs %
3428 2013 Ind 383 Won Aus 326 59 38* 97 464 65.4%
2537 2007 Saf 353 Won Hol 132 47 19 66 302 62.3%*
2749 2008 Win 303 Won Can 254 53 21 74 338 60.7%
3420 2013 Aus 359 Lost Ind 362 75 23 98 438 60.7%
2540 2007 Aus 358 Won Hol 129 51 15 66 294 60.4%
80 or more boundaries in match
2349 2006 Aus 434 Lost Saf 438 87* 26 113* 504 57.8%
2932 2009 Ind 414 Won Slk 411 80 24 104 464 56.2%
3223 2011 Ind 418 Won Win 265 79 14 93 400 58.6%
2823 2009 Ind 392 Won Nzl 334 62 31 93 434 59.8%
3424 2013 Aus 350 Lost Ind 351 79 13 92 394 56.2%
2552 2007 Aus 377 Won Saf 294 72 17 89 390 58.1%
2324 2006 Ind 328 Lost Pak 311 79 8 87 364 57.0%
2962 2010 Ind 401 Won Saf 248 71 15 86 374 57.6%
2303 2005 Aus 331 Lost Nzl 332 65 21 86 386 58.2%
2526 2007 Aus 336 Lost Nzl 340 65 20 85 380 56.2%
1074 1996 Slk 398 Won Ken 254 63 21 84 378 58.0%
2613 2007 Ind 329 Won Eng 320 73 11 84 358 55.2%
2480 2007 Ind 338 Won Win 324 67 16 83 364 55.0%
2390 2006 Slk 443 Won Hol 248 79 4 83 340 49.2%
3318 2013 Eng 325 Won Ind 316 69 13 82 354 55.2%
2527 2007 Aus 346 Lost Nzl 350 56 26 82 380 54.6%
2619 2007 Eng 316 Lost Ind 317 71 11 82 350 55.3%
3136 2011 Hol 306 Lost Ire 307 70 10 80 340 55.5%
20 or more Sixes in match
2852 2009 Ind 339 Won Win 319 42 23 65 306 46.5%
2774 2008 Ind 387 Won Eng 229 56 22 78 356 57.8%
2589 2007 Asi 331 Won Afr 318 56 22 78 356 54.9%
2923 2009 Aus 350 Won Ind 347 55 22 77 352 50.5%
2547 2007 Pak 349 Won Zim 99 31 22 53 256 57.1%
2749 2008 Win 303 Won Can 254 53 21 74 338 60.7%
1125 1996 Pak 371 Won Slk 289 55 20 75 340 51.5%
1569 2000 Aus 349 Won Nzl 301 48 20 68 312 48.0%
2542 2007 Ind 413 Won Ber 156 45 20 65 300 52.7%
A number of interesting facts emerge when we peruse the above tables. The highest percentage of boundaries is in a lop-sided match. It means South Africa really went to town. My apologies! This was upstaged by the Bangalore match, with a mind-boggling 65.4%. The two matches in whom the 100 boundaries-mark was breached produced four 400-plus scores. It is no surprise that the maximum number of fours, 87 to be exact, were hit in the Johannesburg bat-fest.
The maximum number of sixes was reached in the high-scoring match between India and New Zealand during 2009 in Christchurch, surprisingly not in India. India scored 18 of the 31 sixes hit in this match. This is the only instance of the 30-sixes mark being crossed.
Sorry, all these statements have to be re-written at the end of the India-Australia ODI in Bangalore. The maximum number of sixes was reached in the high-scoring match between India and Australia during 2013 in Bangalore, not so surprisingly, in India. As many as 38 sixes were hit and India and Australia hit 19 sixes each. This is only the second instance of the 30-sixes mark being crossed. The 20-sixes mark was breached in 15 other matches.
Finally, have a look at the years in these 29 matches. Twenty-seven of these matches have been played in or after 2000. Only two matches were played before 2000. Both involved Sri Lanka: Jayasuriya, Aravinda de Silva and Kaluwitharana, assisted by Afridi and Saeed Anwar. The match number 2547 is something special. Of the 53 boundaries which were scored, 22 were sixes, a huge 41.5%. The India-Australia match comes next with 39.1%.
To download/view the document with additional data, please CLICK HERE.
Jon Hotten's column reads at the top "They have come to read my article, not your comments". Well, I have a diametrically opposite view. The comments maketh my article. Please feel free to comment any number of times. Initiate the reader-interchanges that were the highlight of "It Figures".
Anantha Narayanan has written for ESPNcricinfo and CastrolCricket and worked with a number of companies on their cricket performance ratings-related systems