Why doesn't cricket have proper metrics for fielding?
We now have a rudimentary fielding average in the BBL, but it's a crying shame there aren't any other, more meaningful, measures
Jarrod Kimber
Jan 5, 2017, 7:53 AM
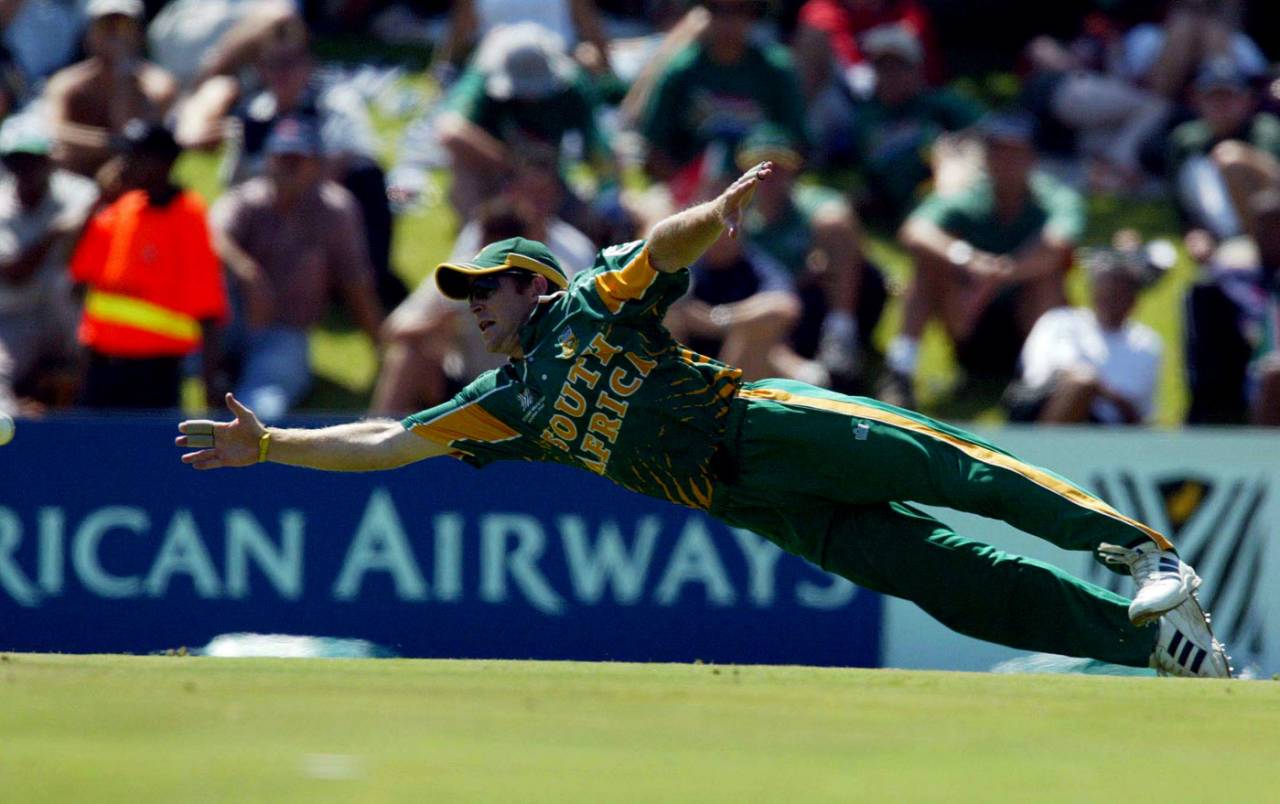
Jonty Rhodes was a terrific fielder, but there is no existing method for quantifying how terrific • Duif du Toit/Getty Images
The ball rebounds off the pads towards point. The point fielder comes in as Inzi is confused about whether he should run, or maybe confused about whether he is running. As he decides to turn back, the point fielder picks up the ball. Inzi is about six metres from the crease, the point fielder is about 12 but has the momentum.
The men are two different specimens - one a wounded buffalo trying to find a waterhole to hide in, the other a cheetah looking for an easy, quick kill. It seems, at least on first glance, that the cheetah is moving so fast that he starts flying. The still image shows him flying, hands and feet stretched out like a human torpedo sent to destroy the stumps. And Jonty Rhodes does kill them, he does run out Inzi, he does fly.
It t is one of the most famous moments of fielding cricket has ever had. Up there with Joe Solomon's run-out in the tied Test, Colin Bland running out Ken Barrington, and Kapil Dev taking the catch of Viv Richards.
And while that fielding was incredible, there is also the other side we remember. The Fred Tate drop, Chris Scott's 483-run Brian Lara drop, and Rhodes disciple Herschelle Gibbs dropping Steve Waugh (read World Cup). But how many run-outs did Rhodes complete in his career? Was it more than Ricky Ponting? Did Ponting have a better accuracy when he threw? Who fumbled more? Cricket doesn't know, and neither do we.
Cricket says catches win matches, and they may, but we don't count them well enough to check. And we certainly don't count them at all when they aren't taken
Chances are you have a favourite fielder, and not just a favourite fielder but probably favourite fielders for different positions. Bob Simpson at first slip, Mohammad Azharuddin at second, Geoff Marsh at gully, Rhodes at point, Clive Lloyd at cover, Brendon McCullum at mid-off, David Boon at short leg, Garfield Sobers at leg slip, and George Bonnor at fine leg. But for all the love they get from cricket fans, cricket doesn't appreciate fielding, because if it did, it would measure it.
Cricket says catches win matches, and they may, but we don't count them well enough to check. And we certainly don't count them at all when they aren't taken. It is one reason why batsmen-wicketkeepers have replaced specialist wicketkeepers, because we count runs, we agonise over them, and if you are lucky, you will see the total catches of a keeper at the end of the column.
Fielding stats just don't exist. Not in any real way. Unless you are Rahul Dravid, the chances are no one will remember how many catches you took. Ponting and Rhodes were great fielders, but which one made more run-outs? While old cricket guys gushed about Bland's phenomenal ability as a cover fielder, we don't how many run-outs he was involved in. Before Charles Davis and ESPNcricinfo ball-by-ball, we didn't even know what the catch-drop ratio of modern players was, or more importantly, have any way at all of tracking dropped catches in cricket.
Cricket Australia is trying to change the way people think about fielding; they have developed a fielding average. For people looking for real information on what happens on a cricket field, and not lazy generalisations, this is an important development.
A large part of the early sabermetrics revolution in baseball showed that fielding was an overrated skill, and getting on base was an underrated skill. Better athletes were chosen over players who could field better, in less spectacular ways. Baseball fielding has been more athletic and of a higher quality than cricket fielding, but weirdly, it might also be less important in the game.
How many times have you heard it said of good fielders, "He's worth 20 runs in the field"? It was something that was often said about Andrew Symonds - that his untold value in the field made him worth far more to his team than a normal player. A proper fielding metric could tell us how much.
While batting averages are not a great way of looking at what a top-order player is worth in T20, let's just say that a decent No. 4 batsman in T20 makes 30 runs a game. Then if you have two options, a player who makes 31 runs a game and another who makes 27, with proper fielding data, you might be able to tell that the 27-runs-a-game player might also bring you two run-outs and four catches more a season, and actively save extra runs in the field than the other player. Then you take the conversation from "He's probably worth 20 runs in the field" to "He's worth 8.3 runs and .35 more dismissals a game in the field than the other guy we could pick in the top order."
The ball is fielded far more often in cricket than in baseball, the catching percentages are far lower in cricket, the stakes on errors are presumably far higher, and therefore cricket analytics could prove that fielding is an undervalued skill. The only way we can know is by tracking it.
That is what Tim Coyle, an assistant coach of Southern Stars, wants to do. On Cricket Australia's website a few weeks back there was an article about giving all players in the BBL a public fielding average. "We went through quite a few different ideas on how we were going to present this, and at the end of the day we decided to try and keep this number as simple as possible," Coyle, who is part of the Australian national fielding panel, said.
They didn't want an entirely accurate fielding-data system but one "that shows fielding performance in a simple way alongside batting and bowling". What is interesting is that they went away from the traditional runs-based methods of working out a player's worth and invented a new metric - which is less an average and more an error ratio.
If you have a player who averages 31 and another who makes 27, with proper fielding data, you might be able to tell that the second player might also bring you two run-outs and four catches more a season, and actively save extra runs in the field than the other player
According to the CA method, the fielding average is calculated by expressing the proportion of grade-one chances taken as a fraction between 0 (no chances taken) and 1 (all chances taken). A perfect fielder would be 1.0. A fielder who drops one out of ten would be 0.9; if they dropped two from ten, 0.80.
The maths is, as Coyle and the team behind it wanted, simple, as is the basic error system behind it. A grade-one error is the most straightforward chance that no professional cricketer would be expected to miss: throwing from a small distance at three stumps, a catch every player would be expected to take. A grade-two error is marginally above expectations. Grade three is a one-handed blinder, hitting one stump from 25 metres, and fielding that ends up on YouTube.
According to the CA data, Rob Quiney is a perfect fielder, at 1.0, and Glenn Maxwell is 0.93. Maxwell has had two grade-one errors, Quiney none. The first problem with this system is that it doesn't tell us if Quiney has had three missed chances at grade two, and Maxwell hasn't missed any; or maybe Maxwell has taken one grade-three chance and Quiney missed both his opportunities of that kind. That might make Maxwell a far better fielder than Quiney, but it wouldn't change his fielding average.
Then there is the fact you can't be better than 1.0. If you take 68 chances from 68, and someone else takes 15 from 15, you will both be perfect. Even if your chances are at the toughest positions in fielding - slip and gully have far higher drop rates than mid-off or square leg - you won't be rated any higher than someone with a perfect record at an easier position. And because you can't be better than 1.0, it doesn't matter how many one-hand blinders you take. If we used a system similar to this for batting, Bradman, Pollock and Headley might all have a perfect batting average, rather than one being 30-odd more than the others. There is also the fact that if you have taken 49 out of 50 chances, and another guy has taken his first 20, he will have a better record.
But maybe the most jarring idea in this system is that it is an errors calculation. The same has been used in baseball for generations, but it has also been derided in that sport, where people are using proper data to try and map fielding worth. There is an entire chapter in Moneyball about the failings of the error system. When you only track the errors, you take out a fielder who simply gets to more balls than others do through pace or desperation. Brendon McCullum might make more errors in the field than Inzamam, but he also stops a lot more.
When it comes down to it, you can't have a proper fielding analytics system that doesn't at least try to take all this into account. CA does have another system - that they keep privately - that looks at fielding impact, and in that, Maxwell is rated higher than Quiney. They are also looking at a fielding strike rate, "the number of dismissals a player gets divided by the number of matches they play". And Maxwell ranks high there as well.
The problem with the fielding average is that in trying to make it simple, "so people understand it" as Coyle says, they have made it almost pointless. I want to know who the best fielder is, not which one misses the most basic balls. What I want isn't "a simple measure of fielding performance"; I want as close to a comprehensive system to work out what a fielder's worth is, and that isn't simple.
Think about one of the most simple moments in a T20 match. A batsman gets a well-directed yorker from a bowler late in a T20 game, and all he can do is bunt it out to long-on. The non-striker has bolted and decides to take a two, the long-on fielder is just a bit slow to react, and this allows the non-striker to make it back just as the bowler takes the bails off. In traditional cricket that is two runs - both runs go against the bowler and go towards the batsman and total.
But the reason there is an extra run wasn't the bowler's fault, and it had little to do with the striking batsman. It was the non-striker and the fielder who combined for the second run, and yet it goes against neither of their names. In a perfect world there would be a metric that allows us to work this out.
With a SportVU camera, spatio-temporal pattern-recognition software, and cricket-specific algorithms, we could work out important and previously unanswerable cricket questions. How long it took the ball to get to the fielder, how far the ball was from the fielder, whether the fielder went straight at the ball, if the fielder took off slowly, how often a second run was successfully made in that situation, and the accuracy and speed of the throw. From that, once enough data is brought in, we could start to work out who played the biggest part in those two runs, and it could be used for everything from wicketkeeping dives to run-out chances. We could tell which fielders make plays, and which ones only execute grade-one chances that any player could make.
But this is quite advanced, and while something of the kind might end up coming to be reality, we are a long way from a system of this sort.
I want to be able to prove a commentator wrong, or right, when he says Kohli is a good fielder. I want to know how often Martin Guptill gets to a ball quicker than most fielders, and how often he then fumbles it
Cricviz is a fielding data system that, considering Nathan Leamon (England Cricket performance analyst at the ECB) is involved, you can assume is similar to what the England team is using. Cricviz counts every incident that affects the score: catches, run-outs, missed chances, misfields and run-saving stops. Then every one of those incidents gets a plus or minus value, depending on how much it changes the team's total. So at the end of a T20, a player could be given a sheet and told if he was plus or minus in the field.
It's still subjective - although it's hard to see how any other system wouldn't be - as there is still an operator who is making the calls of how hard the stop is, and how many runs should be put against the fielder. And Cricviz seems to be overly generous with players who routinely run around balls rather than straight at them, and is quite soft on what actions top-flight players should be able to perform. But their system, flawed as it may be, is still far better than the public CA model. And it is probably a good indication of what the smarter teams are using privately.
Teams are already trying to work out if they are picking the right players.
Look at Melbourne Stars, who have kept Ben Hilfenhaus on their roster. Two balls into his season he looked the goods. Two full, swinging balls, two wickets. But despite Hilfenhaus removing the top of their order, Hurricanes recovered when Tim Paine and George Bailey got together.
In their partnership, they faced Adam Zampa. It was coming out well for Zampa. His skiddy legbreaks and a long leg-side boundary meant that Paine and Bailey had to try to hit him through the off side. On the short off-side boundary, Hilfenhaus was patrolling at point. He had a lot of work to do. At one stage he let them steal the second run. One ball, he saved a boundary but couldn't stop the second run again. There was the three he allowed, which, considering the size of the ground, seemed odd. And also a four that was hit very close to him that he couldn't stop.
There are many ways of explaining what happened with Hilfenhaus on the point boundary. Was he often out of place through bad captaincy, or because he wasn't listening when he was being moved around the field? Should an older fast bowler - even one who is not a terrible fielder - be the man to field on the short off-side boundary when both batsmen are targeting it? Zampa had bowled well, and completely to his plan, but because of the quality of the batting, and the results of the fielding, his dot balls were wasted, given the batsmen could score easily off him later in the over. It meant that Zampa couldn't keep the pressure on, that he didn't get a breakthrough, and ultimately that Hobart was able to play him with complete confidence while smashing him in his last over.
The decision to field Hilfenhaus at deep point and keep him there wouldn't appear to be as important as his two wickets. But it could have been important. For most of cricket's history, where he fielded, or even how he fielded, wouldn't have been important, but now you know that someone was watching and trying to work out if that is a weakness of Hilfenhaus and his team.
In making its system public, CA has taken a significant step forward. Even having a national fielding group at all is smart. They also have an interesting mix, with Coyle; Neil Buszard, a fielding coach with a baseball background; Andy Utting, a former baseballer; and Sunny Kaliyar, a performance analyst. But they are only four people.
There are probably thousands of minds out there watching cricket who have brains equally or more impressive. Some with sports-analytics backgrounds, some with computer-coding backgrounds, and many more with free time and a cricket obsession. Thinking that a small group of people will be able to answer an equation as complicated as fielding is bizarre.
Baseball's big statistical evolution wasn't from people in the front office; it was from people in their lounge rooms trawling through the stats and working out that commonly-held beliefs were wrong. Bill James started as a writer of a self-published book that virtually no one read, and then ended up as front-office staff with the Boston Red Sox.
Cricket has its own Bill James out there. John Buchanan used Krishna Tunga in the early 2000s, for what Buchanan calls alternative cricket analysis. But while there are some data analysts in cricket, there are far more amateurs out there who would do amazing things if they had access to the modern cricket data. Four people, all of whom are not looking at the data full-time, trying to solve one of cricket's great equations is nowhere near as good as a thousand or more doing it. And with the data that Fair Play, the data provider that CA has hired, generates, they could also find other ways to improve teams and learn new things about T20 cricket.
Even now, without this data, people are poring over websites to prove theories or just find out things. Like the blog Right Arm Chuck, which spent quite a lot of time looking at the numbers of drops and catches by Indian slip fielders. It proves what many of us may have already thought, that Ajinkya Rahane is the best slip fielder in India, by a distance. But not just by eye, in numbers: his catch-drop ratio is 3.27; the closest Indian slipper is Murali Vijay, at 1.57. Most of the other slip fielders, even the oft-abused Ravindra Jadeja, are around the 1.5 mark.
While there are some data analysts in cricket, there are far more amateurs out there who would do amazing things if they had access to the modern cricket data
On the blog Declaration Game, there is a simple piece that looks at the drops in the series between England and India using ESPNcricinfo's ball-by-ball coverage. According to it, India took 50 of their 76 chances (66%) and England took 47 from 65 (72%). Meaning that, on their recent numbers, both had a poor series. Alastair Cook took four from seven and Virat Kohli five from ten.
And then there is Charles Davis, whose blog, and work for other publications, has delved as deep into cricket's data science as any amateur with a laptop can. He put up a blog post on teams' missed-chances percentages in Tests between 2013-14 and 2014-15. It was the era when New Zealand, fired up by McCullum, the continued brilliance of Kane Williamson, and the partnership of Trent Boult and Tim Southee had one of their most successful runs ever. It was also when they only missed 20% and 19% of their chances. Go through all the articles on their rise, mine included, and you won't find those incredibly important numbers. You might hear that they are a good, great, or even the best fielding side, but it's subjective. Davis isn't giving us subjectivity; he's giving us facts and numbers.
Not enough people have ever asked why throws in baseball have been better than in cricket for generations, despite the fact that cricketers throw more often. Or wondered why, if 47% of caught-and-bowleds at Test level are dropped according to Charles Davis, teams still almost never train their bowlers in them, though almost as many chances go there as to point. That is two major cricket inefficiencies that could provide teams with improvement straightaway.
The fielding in the Big Bash so far has been abysmal. Sydney Thunder could point at dropped chances for two of their losses. When Brisbane Heat travelled to Adelaide, it seemed like both teams had made a pact to field poorly. The two best catches that night were Kieron Pollard's Superman grab and the security guard's pouching a six.
And yet, for all the scorecards I can find online, there is still nothing regular telling me about how important fielding is in each game. It happens, is commented on and then forgotten. I want to know what percentage of the time David Warner hits the stumps. I want to be able to prove a commentator wrong, or right, when he says Kohli is a good fielder. I want to know how often Martin Guptill gets to a ball quicker than most fielders, and how often he then fumbles it. I want to know which players create wickets through their forgotten third skill. I want to know it all.
And cricket tells me almost nothing. TV coverage doesn't have simple catch-drop ratios. Newspapers do little more than mention important drops, and if you are lucky, the numbers of drops a game, day, or maybe a series. Even ESPNcricinfo's profiles only mention the number of catches or stumpings by a player, with no mentions of run-outs. Even with the fielding average being made public, it has barely made it to any of the coverage of the Big Bash.
"We need to walk before we run" is how Coyle described CA's fielding average. Their system is a toddler in the world of fielding data, but it is the sort of thing that should have happened about a hundred years ago. This article itself is overdue. Cricket has spent many lifetimes ignoring fielding, and even if the fielding average might tell us almost nothing, almost nothing is so much more than we've ever had.
Ponting completed 12 more international run-outs than Rhodes, Coyle told me. He's probably right, but it's not like I can go anywhere to check it. Rhodes could fly through the air, and while that is amazing, what he really should have taught us is not that he was superhuman but that fielding matters. And hopefully one day, we will know how much.
Jarrod Kimber is a writer for ESPNcricinfo. @ajarrodkimber