Tendulkar's Test career: into uncharted waters
An objective statistical analysis of Sachin Tendulkar's Test career
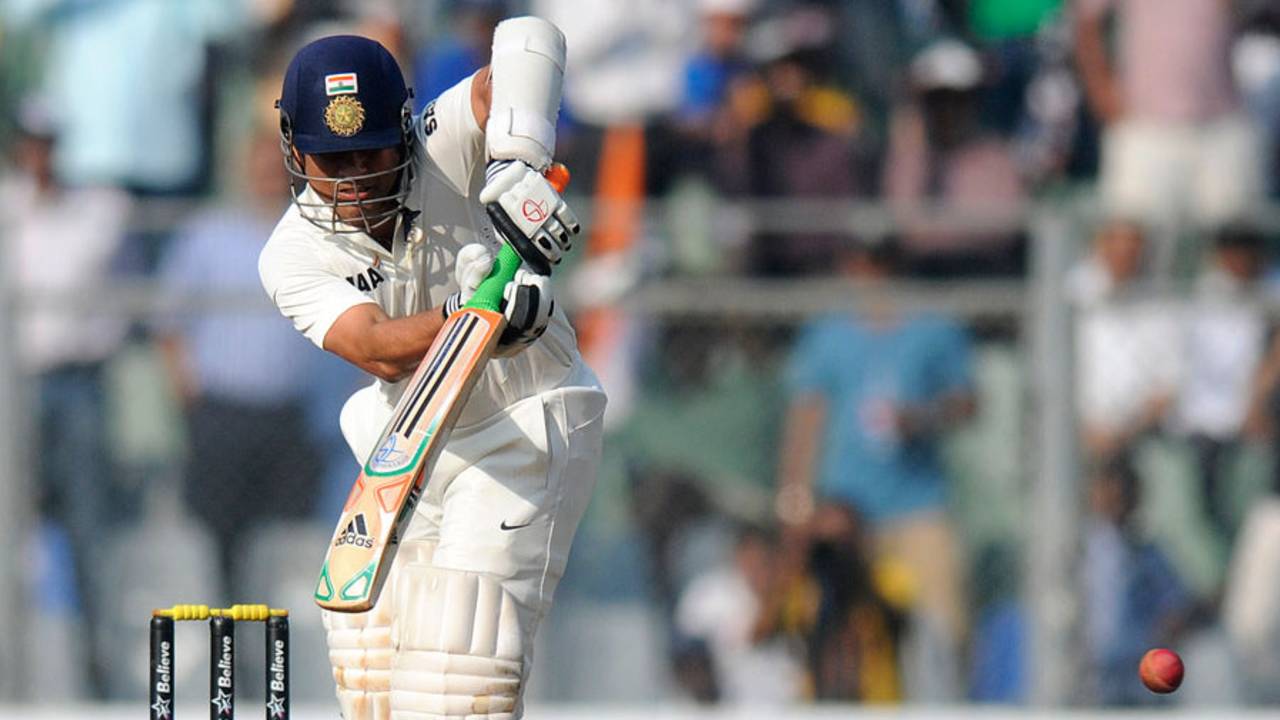
Sachin Tendulkar saw a few ups and downs during his Test career. • BCCI
In this second part of Sachin Tendulkar's career, I will look at Tendulkar's Test career. This follows the first part, which concentrated on ODIs. I emphasise that this will also go off the much-traversed path. These have been two really tough articles, trying to do proper justice to two great careers, and have taken a lot out of me. I look forward to some complex articles, but easier to handle, in the weeks to come.
There was one problem with the first article. Quite a few readers skipped the graphs and tables, moved on to the last paragraphs and bang came their beamers. This time, if they do it, they have a surprise waiting at the end. I request the readers to take the time to read the article in its entirety before coming out with their comments.
Tendulkar's Test career graph
I liked the graphical representation of Tendulkar's ODI career a lot and have repeated the same here. Many people have done the graph of actual innings scores. However this is based on the Career-to-date figures and offers clearer insights. Instead of strike rates I have used the important metric of career-to-date balls-per-innings (BPI). The link is the strike rate.
This graph is quite unlike the ODI one where, after the initial low-profile period, Tendulkar picked his average up quite quickly (relative to his remaining career), and then reached a plateau and virtually stayed there for the last 250 matches or so. That is quite unlike the usual bell curve of a typical batsman. Here, in tests, the graph movement is far more complex.
After a lacklustre opening period, Tendulkar moved up into a good performance zone. Then he dropped off quite steeply. Afterwards there was a long period of dominance, the golden era of Tendulkar's batting. Then there was one more slump, which everyone thought was a career-ending drop. To his eternal credit, he got a third wind and almost touched the mid-career peaks again around 2010-11. Finally the inevitable slump happened and Tendulkar finished well off his glittering top values. The last slope in the curve is clearly visible.
The BPI movement has been even more up-down-up-down type. In general it seems to match the average movements. Because of the number of matches/innings played, the changes are clearer in the career-segment graph displayed later.
The career-high batting average value was reached in Test #1599 during the Indian tour of West Indies in 2002. At the end of the first innings score of 117, Tendulkar's career average was 59.17. By an amazing coincidence, the career-high BPI value also reached its peak at this very point. The 260-ball innings pushed the career-to-date BPI value to 97.54. These places are marked with dots on the graphs.
Ignoring the first-ten Tests, the career-low batting average value was reached in Test #1180 during India's tour of Australia of 1991. At the end of the first innings score of 15, Tendulkar's career average was 34.78. This time there has been a slight change. The BPI value reached its lowest level during Test #1200 during the Indian tour of South Africa of 1992. The 24-ball innings pushed the career-todate BPI value down to 71.26.
Tendulkar's Test career graph - split into 6 parts
I have divided Tendulkar's Test career into six parts, unlike the ODI graphs where I had opted for five parts. The reasons are special to Tendulkar's career, which unlike that of most players, was not a bell-shaped career, as already explained. His middle Tests consisted of two totally variant halves because of the injury and loss of form during the early 2000s. Hence I decided to split the career into six parts. The first-two having 33 Tests each, the middle-two having 34 Tests each and the final-two, 33 Tests each. It is also a fact that 33 Tests require around four years and represent a sufficiently long period for analysis.
Tendulkar's Test graph is a complete contrast to his ODI graph. There he went to the peak and virtually plateaued just below that for the rest of his career. In Tests, he had a good start, and then moved up rapidly in the second segment. From low averaging in low 50s and BPI of 88, he moved up to an average of 58 and BPI of 97. There begins the Tendulkar golden era. In the next 34 Tests, he averaged 64 and had BPI of 101. This is the only period in which he exceeded 100 balls per innings. His strike rate also improved.
Then came the fall. In the next 34 Tests, his average dropped by 19 runs, and more alarmingly, his BPI figure fell alarmingly to 78. This means that he was playing 23 balls less per innings. The strike rate also dropped by ten-percent. The double blow almost raised fears of a career close. However the fifth segment was something from the fantasy world. Tendulkar found the inner strength to increase his strike rate by 10% and the average BPI by 15%. The combined effect was a restoration of the average to a majestic 56. This period ended in 2010.
There is no doubt that the last period, especially the last 15 Tests, was well below the high standards expected of Tendulkar. Both strike rate and BPI dropped: leading to a low average of 45.81. But wait a moment. To my knowledge, Tendulkar carried his good form of 2010 for some time beyond. I remember the couple of double-hundreds. So this is clearly not a single homogeneous period of 33 Tests. There are two sub-periods which are at a great variance to each other. If this can be split into two sub-groups of 16-17 Tests each, we will get a clearer insight. Let me do that and we will see the numbers after the table.
| From | To | Inns | NotOuts | Runs | Balls | Avge | S/R | BpI |
|---|---|---|---|---|---|---|---|---|
| 1 | 33 | 47 | 5 | 2142 | 4190 | 51.00 | 51.1 | 89.1 |
| 34 | 66 | 54 | 4 | 2849 | 5171 | 56.90 | 55.1 | 95.8 |
| 67 | 100 | 59 | 6 | 3414 | 5997 | 64.42 | 56.9 | 101.6 |
| 101 | 134 | 55 | 7 | 2185 | 4288 | 45.52 | 51.0 | 78.0 |
| 135 | 167 | 58 | 7 | 2949 | 5251 | 57.82 | 56.2 | 90.5 |
| 168 | 200 | 56 | 4 | 2382 | 4553 | 45.81 | 52.3 | 81.3 |
| Split | ||||||||
| 168 | 184 | 30 | 3 | 1644 | 3178 | 60.89 | 51.7 | 105.9 |
| 185 | 200 | 26 | 1 | 738 | 1375 | 29.52 | 53.6 | 52.9 |
Ah! Now we get the important split of the last 33-Test period. In the first 17 Tests of this period, Tendulkar performed at even better than his fifth period performance. An increase of average by 4, a huge increase in the balls played per innings, albeit at a slightly more sedate pace. The last 15 Tests were something else. He went below 50% of the previous sub-period in average and BPI. The strike rate was fine, even better. So it is this halving of balls per innings in the last 15 Tests, which caused the slump. But really it does not matter. All players go through form drops at the end of their careers and Tendulkar was no exception. It would be silly on the part of anyone to say that he should have retired at the end of his 185th Test because, the great player that he is, he wanted to give it a game try. And quit when he realised that there was no comeback. Although, one must admit in ODIs he maintained the high plateau level right to the end.
| Bowler | Type | Balls | Runs | Wkts | BpW | Avge | S/R |
|---|---|---|---|---|---|---|---|
| MG Johnson | LF | 502 | 250 | 3 | 167.3 | 83.3 | 49.8 |
| PL Harris | lsp | 441 | 154 | 3 | 147.0 | 51.3 | 34.9 |
| B Lee | RF | 432 | 242 | 5 | 86.4 | 48.4 | 56.0 |
| M Muralitharan | rob | 366 | 196 | 6 | 61.0 | 32.7 | 53.6 |
| JM Anderson | RFM | 350 | 208 | 9 | 38.9 | 23.1 | 59.4 |
| AF Giles | lsp | 348 | 125 | 1 | 348.0 | 125.0 | 35.9 |
| A Flintoff | RF | 342 | 133 | 2 | 171.0 | 66.5 | 38.9 |
| DL Vettori | lsp | 314 | 95 | 3 | 104.7 | 31.7 | 30.3 |
| DW Steyn | RF | 310 | 149 | 3 | 103.3 | 49.7 | 48.1 |
| MS Panesar | lsp | 304 | 149 | 4 | 76.0 | 37.2 | 49.0 |
| MJ Hoggard | RFM | 292 | 182 | 3 | 97.3 | 60.7 | 62.3 |
| Mohammad Sami | RF | 287 | 127 | 1 | 287.0 | 127.0 | 44.3 |
| Mohammad Rafique | lsp | 283 | 140 | 1 | 283.0 | 140.0 | 49.5 |
| GP Swann | rob | 279 | 150 | 4 | 69.8 | 37.5 | 53.8 |
| Danish Kaneria | rlb | 269 | 151 | 1 | 269.0 | 151.0 | 56.1 |
| M Dillon | RFM | 267 | 163 | 2 | 133.5 | 81.5 | 61.0 |
| BW Hilfenhaus | RFM | 250 | 161 | 0 | 250.0 | 161.0 | 64.4 |
| ---------- | |||||||
| PM Siddle | RFM | 216 | 141 | 4 | 54.0 | 35.2 | 65.3 |
| M Morkel | RF | 190 | 139 | 1 | 190.0 | 139.0 | 73.2 |
| GB Hogg | lws | 154 | 138 | 0 | 138.0 | 154.0 | 89.6 |
| CT Tremlett | RM | 194 | 59 | 1 | 194.0 | 59.0 | 30.4 |
| Shoaib Akhtar | RF | 140 | 79 | 2 | 70.0 | 39.5 | 56.4 |
| NM Lyon | rob | 196 | 115 | 4 | 49.0 | 28.8 | 58.7 |
| M Ntini | RF | 154 | 94 | 4 | 38.5 | 23.5 | 61.0 |
I have already done an overall analysis of the head-to-head confrontations between batsmen and bowlers for matches after Test #1546. This included a peripheral look at Tendulkar. In this article I will be looking at the Tendulkar-Bowler confrontations in depth. The table is ordered on the number of balls bowled by the bowler (to Tendulkar).
Mitchell Johnson has bowled the maximum number of balls to Tendulkar. However it is clear that Tendulkar had the real measure of Johnson. Only three dismissals in over 500 balls at a reasonable strike rate confirm that. Paul Harris has kept Tendulkar quiet but has taken a wicket only once every 25 overs. The Lee-Tendulkar confrontation has been a draw. Brett Lee has dismissed Tendulkar every 14 overs but has also conceded quite a few runs. The Steyn-Tendulkar match up has to be called a success for Tendulkar. Considering that Dale Steyn captured a wicket every 42 balls in his career, his 103 balls per Tendulkar wicket is certainly favourable to Tendulkar, even conceding the fact that these are top-order wickets.
Now we come to the two bowlers who have really got the better of Tendulkar. Muttiah Muralitharan has dismissed Tendulkar every 61 balls and James Anderson, every 39 balls. Anderson has also been the most successful bowler against Tendulkar, accounting for nine of his dismissals. Ashley Giles, another left arm spinner like Harris, has had very little success against Tendulkar but has kept him very quiet. A single dismissal in the 58 overs Giles bowled to Tendulkar. And look at Daniel Vettori's economy rate against Tendulkar. Monty Panesar has had more success but does not have the low economy rate of the other left arm spinners.
The latter entries have been shown to highlight the outliers. Morne Morkel and Brad Hogg have been taken to the cleaners by Tendulkar. Surprisingly Chris Tremlett has almost the best economy rate against Tendulkar, rivalling Vettori's figures. Shoaib Akhtar had reasonable success against Tendulkar. Quite surprisingly Nathan Lyon had very good figures against Tendulkar, probably because he caught him during his declining years. But Makhaya Ntini has had a lot of success, matching Anderson's figures, and is the most successful bowler against Tendulkar.
The summary is that the right arm fast bowlers have been relatively more successful against Tendulkar while the left arm spinners kept him quiet but could not make much headway. The off-spinners have been quite successful: mainly Muralitharan, Graeme Swann and Lyon. Tendulkar faced only one left-arm pace bowler of note and handled him quite well. Let us not forget that this covers 116 of the 200 Tests Tendulkar played.
| Batsman | AvgBatPos | Inns | TS | TSPts | 2TS | 2TSPts | TotPts | HSI |
|---|---|---|---|---|---|---|---|---|
| 1-2-3 batsmen | ||||||||
| DG Bradman | 3.65 | 80 | 30 | 56.1 | 14 | 10.0 | 66.1 | 0.8268 |
| BC Lara | 3.77 | 230 | 65 | 143.0 | 34 | 22.6 | 165.6 | 0.7201 |
| L Hutton | 1.23 | 138 | 39 | 82.8 | 22 | 16.6 | 99.3 | 0.7196 |
| JB Hobbs | 1.20 | 102 | 31 | 55.7 | 19 | 13.7 | 69.5 | 0.6810 |
| SM Gavaskar | 1.26 | 214 | 60 | 110.6 | 30 | 21.9 | 132.5 | 0.6193 |
| WR Hammond | 3.66 | 140 | 40 | 73.1 | 17 | 13.0 | 86.1 | 0.6149 |
| GA Gooch | 1.46 | 215 | 50 | 99.4 | 33 | 23.8 | 123.2 | 0.5729 |
| H Sutcliffe | 1.06 | 84 | 25 | 38.7 | 12 | 9.0 | 47.8 | 0.5686 |
| V Sehwag | 1.30 | 178 | 38 | 88.4 | 20 | 12.8 | 101.2 | 0.5685 |
| KC Sangakkara | 3.02 | 200 | 48 | 90.4 | 31 | 22.1 | 112.5 | 0.5626 |
| 4-5-6 batsmen | ||||||||
| KF Barrington | 4.04 | 131 | 38 | 73.6 | 25 | 18.1 | 91.7 | 0.7000 |
| ED Weekes | 4.15 | 81 | 21 | 43.0 | 14 | 9.6 | 52.7 | 0.6500 |
| A Flower | 5.03 | 112 | 28 | 50.3 | 17 | 11.9 | 62.2 | 0.5556 |
| PA de Silva | 4.38 | 159 | 35 | 67.8 | 24 | 15.1 | 82.9 | 0.5212 |
| S Chanderpaul | 4.84 | 255 | 54 | 91.4 | 58 | 39.1 | 130.4 | 0.5115 |
| Mohammad Yousuf | 4.64 | 156 | 30 | 57.6 | 29 | 20.6 | 78.2 | 0.5012 |
| IVA Richards | 4.16 | 182 | 42 | 75.5 | 23 | 15.1 | 90.6 | 0.4981 |
| SR Tendulkar | 4.24 | 329 | 78 | 133.6 | 43 | 30.0 | 163.6 | 0.4974 |
| DJ Cullinan | 4.15 | 115 | 22 | 44.1 | 20 | 13.1 | 57.2 | 0.4974 |
| DCS Compton | 4.34 | 131 | 29 | 50.0 | 22 | 15.0 | 65.0 | 0.4960 |
I liked this work which I had done in my previous article analysing the occasions when a batsman had top-scored or put up the second top-score. I have explained this here to keep in the picture those who missed the ODI article.
When a batsman top scores in a Test innings, there is no denying that he has contributed very significantly to the team cause. Yet it need not necessarily be the real match winning innings. However the innings would have gone a long way in helping the team cause. Earlier I have done some analysis considering the top score situations in their absolute form. However, I have since realised that I have to take care of radically different situations such as the two top scores being 108 & 100 and 108 & 27. In the first case the top-scorer has had excellent support with a score nearing his own. In the latter case, there has been very little support. It is also essential that the 100 in the first case has to be given significant recognition.
Hence I have now worked out a very accurate and simple algorithm. If a batsman is the top-scorer, he gets an index value equal to "Batsman score / the next highest score". Thus the batsman who scored 108 in the first match will get 1.08 points. The batsman who scored 108 in the second match will get 4.0 points. Similarly the batsman who scored 100 in the first match will get 0.926 points ("Batsman score / the highest score") and the batsman who scored 27 in the second match will get 0.25 points. The points are summed and divided by the number of innings played to arrive at a High Score Index (HSI). The batsman score has to be either the top score or the next highest one to be considered for the index calculation. I included batsmen who have scored 4000 Test runs and have a batting average of 25 or higher.
The one tweak I have done for Tests is to recognize that the batsmen who have batted at the top-order (batting positions No. 1 to No. 3) for most of their careers have a significant advantage in finishing with the top or next score. Hence, I have presented this data in the form of two tables, using the 'average batting position' (ABP) value of 4 as a separation point. Those with an ABP value of below 4 have batted in 1-2-3 more often than in lower positions while those with ABP exceeding 4.0 have batted in positions 4 or later more often. This enables to look at this table in a better way.
The highest HSI in ODIs was Hashim Amla's 0.673. It is to be expected that the Test scene would be quite different. The innings are longer and there is no limit to the number of overs. Hence this would allow for greater variations between the top score and the next highest one. This is confirmed by the numbers. Let us first look at the category of top-order batsmen. It is no surprise that Don Bradman tops the table with a HSI value of 0.826. He top scored in 30 of his 80 innings and was the next highest one in another 14. It is also not a surprise that Brian Lara is in the second place, by a hairs-breadth from Len Hutton. It is an open secret that Lara carried his team for a long time and was either the top-scorer or the next best scorer in 99 innings. Then England's duo of Hutton and Jack Hobbs follow. Sunil Gavaskar is right up there with an excellent HSI value of 0.619. Surprisingly Virender Sehwag, for all the attacking batsman-ship he essayed, is present in the top-ten.
Now we come to the middle-order (batting positions No. 4 to No. 6) batsmen. Ken Barrington tops the table with a HSI value of 0.700. Everton Weekes, playing in a strong team and Andy Flower, playing in a weak team, occupy the next two places. There is no surprise at the next three, who were the premier middle-order batsmen of their teams: Aravinda de Silva, Shivnarine Chanderpaul and Mohammad Yousuf.
Enter the two batsmen who dominated the ODI game, Viv Richards and Tendulkar. Both Richards and Tendulkar have HSI values just below 0.5, indicating that they did not really lead the Test scene for their country as they dominated the ODI arena. The strong batting line-ups have also contributed to this. In Tendulkar's case, it is clear that he would get less opportunity to be a top-scorer in an innings since he batted at no.4 or later in 328 of his 329 innings. There were three batsmen ahead of him with a head-start.
The HSI is a fascinating metric and will require a separate article, incorporating important tweaks suggested by readers. The mean-determination basis has to be changed. Also there is a case for keeping the top-scorer at 1.0 and all others, a subset of this value. This will avoid the two independent computations.
| Starting Test | Year | Inns | NOs | Runs | Balls | Avge | S/R | 100s | 50s |
|---|---|---|---|---|---|---|---|---|---|
| 162 | 2009 | 16 | 2 | 1323 | 2275 | 94.50 | 58.2 | 6 | 5 |
| 71 | 1999 | 18 | 1 | 1177 | 1980 | 69.24 | 59.4 | 4 | 5 |
| 54 | 1997 | 16 | 1 | 1136 | 1788 | 75.73 | 63.5 | 6 | 1 |
| ... | |||||||||
| 187 | 2012 | 16 | 1 | 337 | 697 | 22.47 | 48.4 | 0 | 2 |
| 126 | 2005 | 16 | 1 | 387 | 786 | 25.80 | 49.2 | 0 | 2 |
| 11 | 1990 | 16 | 1 | 508 | 967 | 33.87 | 52.5 | 3 | 0 |
In this table I have looked at the three-best streaks and three-worst streaks in Tendulkar's career. These are ten-Test streaks and non-overlapping.
The best streak of ten Tests was from Tendulkar's 162nd match played during 2009, his golden return period. In ten Tests he scored 1323 runs at a good scoring rate of 58.2. The average was 94.50, 90% higher than his career average. The sequence of his scores reads 53, 105*, 16, 143, 7, 100, 106, 8, 84, 203, 41, 54, 98, 38, 214 and 53*. One heck of a sequence indeed. Six centuries, two of them of the double, in ten Tests. India's won-draw-loss (W-D-L) record in these Tests was a very impressive 7-1-2. Of course, we cannot ignore the contributions of the other players.
In the second best-streak, India's W-D-L record was a surprising 2-2-6, despite Tendulkar's stellar contributions. These were the days when he fought the battles almost single-handedly. In the third one, the record was again 2-5-3, somewhat similar to the second one.
The worst streak of ten Tests was from Tendulkar's 187th match played during 2012, his winding down period. In ten Tests he scored 337 runs at an average scoring rate of 48.4. The average was 22.47, 60% lower than his career average. The sequence of his scores reads 15, 8, 25, 13, 19, 17, 27, 13, 8, 8, 76, 5, 2, 81, 13* and 7. A disastrous sequence with two fifties in ten Tests. India's won-draw-loss record was a reasonable 5-1-4, indicating that Tendulkar's non-contribution was compensated by the efforts of the other players quite effectively.
A simpler analysis of Tendulkar's career reveals that the 20 sequential ten-Test slices reveal run accumulations of 577, 508, 878, 697, 778, 906, 1036, 1177, 1038, 810, 559, 915, 551, 720, 727, 1000, 1096, 878, 682 and 358 runs. Thus he has scored 1000 runs or more in five of these slices. There were also five occasions when fewer than 600 runs were scored.
This sub-analysis also indicates the importance of getting good support from team-mates. The team did much better in later years, even with Tendulkar's non-contribution, than when he played his heart out, during the earlier years.
| Innings classification | Inns | Runs | Avge |
|---|---|---|---|
| Real failures | 71 | 544 | 7.7 |
| Failures | 21 | 572 | 27.2 |
| Reasonable Inns | 22 | 911 | 41.4 |
| Good Inns | 33 | 2326 | 70.5 |
| Outstanding Inns | 21 | 2987 | 142.2 |
| Total | 168 | 7340 | 43.7 |
This is the first time I have attempted an analysis of this type. Look at how a batsman coped when he arrived at a somewhat difficult situation. As such this is still a rough stone and needs some polishing. Also I have not done this across batsmen. In which position the batsman batted at is quite relevant. I have looked at it only from the angle of Tendulkar. Hence we cannot do any comparisons. We have to draw any conclusions by looking at the figures in isolation. I have also avoided complicating the situation evaluation methodology. Not easy to do that effectively. With this introduction let us go on to the analysis itself.
First let us get some facts in. In the 329 innings Tendulkar took guard, he batted at opening once, never at No. 3, 275 times at No. 4, 30 times at No. 5, 19 times at No. 6 and four times at No. 7. So the no.4 position matters the most.
I have worked on the assumption that if a batsman walks in at team scores which are worse than 74 for 2, 115 for 3, 155 for 4 and 191 for 5, the situation is not particularly good. How have these "magic numbers" appeared? On a sound basis, I can assure all. As part of our comprehensive Player contribution work, Milind and I have developed the resource available at the fall of each wicket by analysing all 2100+ matches. The relevant numbers are 87.9% at the fall of first wicket, 75.2% at the fall of the second wicket, 61.6% at the end of the third wicket, 48.3% at the fall of the fourth wicket and 36.3% at the end of the fifth wicket. I have used 300 as a minimum expectation of the innings score and derived these values. It does not mean that if the score was 75 for 2, it is very much better than 74 for 2. But we have to draw the line somewhere and can be improved as suggestions come in. 74 is not a magic number but a starting point.
Let us look at 45 for 2. Whether on the opening day, facing a first innings of 250 or 400, batting in the third innings 100 behind or ahead or chasing a target of 150 or 300, this is not a good position to get in. The No. 4 batsman has to work with the batsman at crease to re-build the innings. Same is true for the other scenarios. As I write this, Australia's first innings at the Gabba is under way. Michael Clarke got in at 71 for 2, which is not a great situation. However, when Clarke was dismissed, Steven Smith walked in at a difficult situation of 72 for 3; George Bailey came in at a far more difficult situation of 88 for 4.
In his career Tendulkar walked into 175 such situations. The complete details are in the downloadable document. Seven of these situations can be ignored. In four cases Tendulkar remained not out in won matches. In two other innings India was going for a declaration in the third innings and Tendulkar played cameos as per team needs. That leaves us with 168 innings, nearly 50% of the Tendulkar's career tally.
Out of these 168, Tendulkar played outstanding innings above 100, 21 times. In all these occasions India recovered quite well. In 33 other innings Tendulkar crossed 50. All these innings laid the foundation for recovery. In 22 other innings, Tendulkar went past 35 and stemmed the rot. So it can be argued that Tendulkar performed quite effectively in 76 of these innings. This is around 45% of the difficult situations.
The other 92 occasions represent failures at different levels. 71 of these were real failures, averaging 7.9 runs per innings and 21 were slightly better but he averaged around 27. Let us not forget that these are all dismissals. That means, in a match such as #1335, Tendulkar came in at 25 for 2 and India needed 58 to win. Tendulkar was out for 0 but India won comfortably. But this is treated as a failure, correctly.
Finally the fact that 21 of Tendulkar's 51 hundreds were scored in difficult situations is very important. Let me emphasize that these are just facts presented without any conclusions. There is no comparison made with anyone since the base varies.
Finally, something from my heart. I have given below, with brief phrasal comments because of the length of the article, my favourite Tendulkar innings, not in any particular sequence. For those who feel that these innings deserve outpourings from the heart rather than single-phrase aphorisms, let me plead guilty and point to the length of the article.
114*: 1992-1186-Perth. In the teens, off a top bowling attack, the highest score of the match.
116 : 1999-1479-MCG. Similar to the Perth innings. Probably better and against a better attack. No one else did no nothing, as the Americans would say.
241*: 2004-1680-SCG. A classic. Possibly Tendulkar's best Test innings. A tactical masterpiece.
119*: 1990-1149-Manchester. 17 years and a few days. Match-saving innings. Amongst Tendulkar's best.
122 : 1996-1327-Birmingham. 17 for 2 through 68 for 5 to 219 all out. No one crossed 20. A truly defiant effort.
111 : 1992-1201-Jo'Burg. Similar to Perth/MCG/Birmingham. Another teenage masterpiece. Next highest score 25.
146 : 2011-1988-Cape Town. A modern classic. Off a top-class attack. Genuine match-saver.
105*: 2010-1949-Chittagong. Match against Bangladesh? One of Tendulkar's best efforts ever. Without this innings, India would have lost.
155*: 1998-1405-Chennai. This was a game-changer. Not a great attack but the execution was flawless. Warne was mastered.
214 : 2010-1973-Bangalore. In at 38 for 2. Against a huge score. Match-winner all the way.
136 : 1999-1444-Chennai. An unfinished symphony. A fourth innings classic. Unfortunately Tendulkar could not complete the task and his team-mates let him down.
175 (141): 2009-2923-Hyderabad. Possibly Tendulkar's best ODI innings. Like the 136, he could not complete the task and his team-mates again let him down.
200*(147): 2010-2962-Gwalior. Reminds one of Tensing and Hillary. First to climb the 200-peak. Off a good attack.
134 (131): 1998-1327-Sharjah. Which of the two classics to take? The match-winner in the Final gets the nod. The other scores (23 off 42, 28 off 41 and 58 off 64) tell the story.
98 (75): 2003-1975-Centurion. Off a truly frightening attack. Amongst Tendulkar's best ever ODI innings. Those upper-cuts and the intent shown. Akhtar and Younis went for 9+ runs per over.
It is possible that I have missed an innings or two. Please feel free to contribute, if possible, avoiding the phrase 'Desert Storm'. I have done justice to it myself.
Clinton had suggested that I look at the Man-of-the-Match (MoM)/Man-of-the-Series (MoS) awards as a measure of the player contributions. I see that there is a lot of value in that. However, it is not correct to do that in this single-player centric article. Tendulkar was a batsman first and foremost. The MoM awards are given across the spectrum, for batting, bowling, all-round performances and the like. It would be unfair to Tendulkar if he is compared, in this article, to others who have the advantage of claiming the awards for multiple disciplines. No conclusions can be drawn. Maybe I will do a separate piece on this topic later. Suffice to say that, Tendulkar won 14 Test MoM awards, 62 ODI MoM awards, 5 Test MoS awards and 15 ODI MoS awards. He is ahead of the next player by a few kilometres. Moreover we should not forget that some of the matches Tendulkar played in did not have any awards: six Tests and 15 ODIs.
It is quite possible that you may disagree with some of the points expressed here. You have one of three options. Make your counter-point with supporting arguments. I will give respect to your views and publish your comment with my own responses. You could make your counter in an acceptable form with no supporting points. No problems. I will publish your comment, mostly with no response from me. Finally you cross the lines set and go rude and offensive. You insult me, another reader or any player. As night follows day, your comment will be junked. You have every right to be critical of me but no right to be abusive. Thanks in advance for following the simple rules set.
Tendulkar has played cricket for over a quarter century. What is there in store for him and what could he do for Indian cricket/sports?
The Mumbai Indians have already indicated that he would be with them in a major role. Probably "Mentor Emeritus". They may then not need Anil Kumble. But they can also afford to keep both. There is no doubt that Tendulkar would do an excellent job at Mumbai, a city he loves most and a team he has been part of from day one. But that is only three month's commitment. What else?
Spreading sports in schools seems to be too undefined a role. Would he be a part of the Indian cricket scene? He is unlikely to touch a Coach/Manager's job with a ten-foot pole. A mentor role might be superfluous for India's batsmen. Tough to envisage a useful role for him in this area.
I can see Tendulkar as an expert commentator, making periodic appearances, but not in a full-time commentator role.
What about a semi-political role? Sports Minister? Unfortunately this is likely to be a political appointment. What the UPA government does, the NDA government might throw out and vice versa, for political reasons. How would he handle the politicians, bureaucrats and the rebel sports federations, starting with cleaning up IOA? Tough task on hand.
Only thing I know for certain is that he will have the best wishes of all people everywhere. I hope, wish and pray that Tendulkar has a wonderful retirement and has great fun. Also that he scores the equivalent of 35,000 plus runs, albeit off the cricket field, in the 40-plus years to come in life. He has earned all the good wishes, in spades.
To download/view the documents containing the 7 complete tables, please CLICK HERE. My take is that many of the questions can be answered if you download this 1380-line file and view the contents. Instead of asking me where is Rahul Dravid placed in the HSI table? or how did Tendulkar fare against Jacques Kallis? or what about his streak in 2010? you could download the file and view the tables.
Anantha Narayanan has written for ESPNcricinfo and CastrolCricket and worked with a number of companies on their cricket performance ratings-related systems