Draw-fests at the SSC
The SSC has consistently produced pitches that are loaded in favour of batting. Shouldn't this be questioned, just as Galle was last year?
S Rajesh
06-Jul-2012
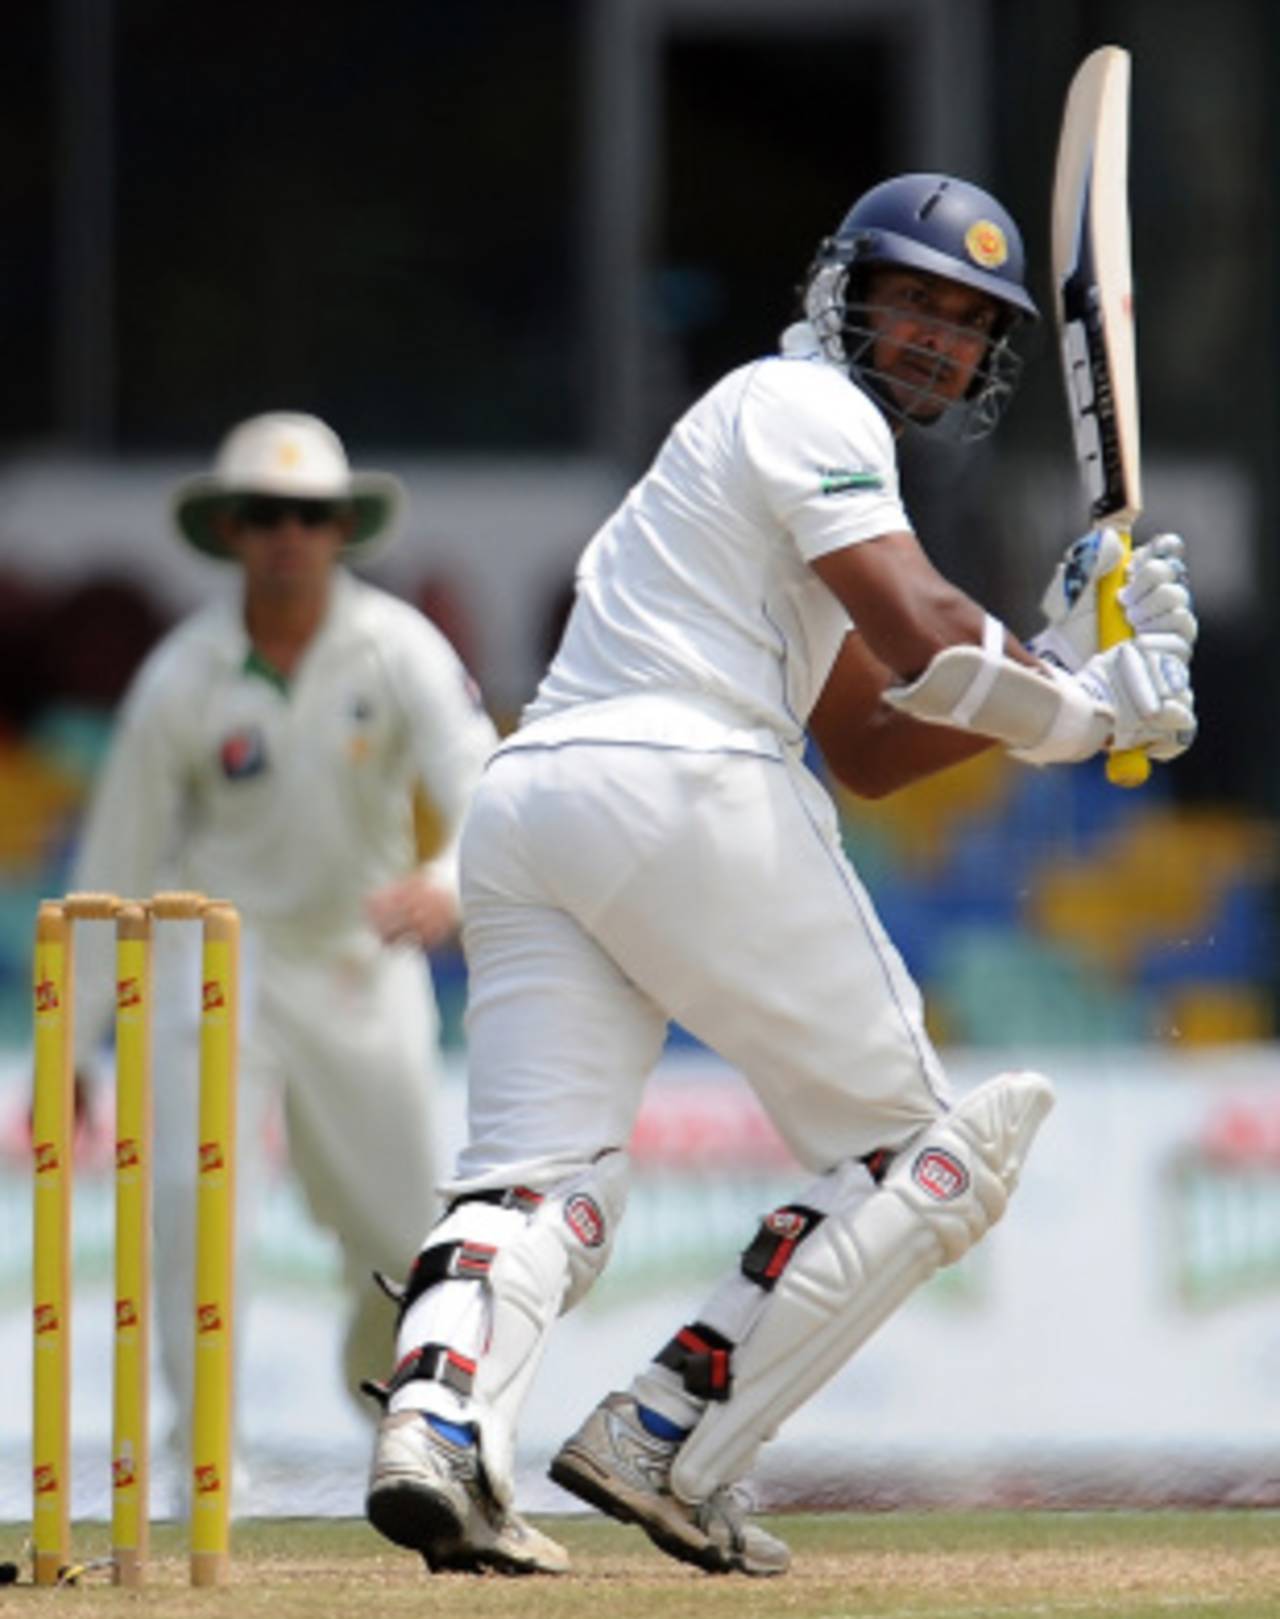
Kumar Sangakkara averages 115.75 in Tests at the SSC since the beginning of 2006; at Galle over the same period he averages 40.86 • AFP
In September last year, Sri Lanka Cricket were slapped with an official warning after the Galle pitch which was served up for the Test against Australia was termed 'poor' by Chris Broad, the match referee, for excessively assisting spinners. The decision was a controversial one. The Australian batsmen seemed to agree with the ICC's move; Ricky Ponting equated it to Mumbai's dustbowl of 2004, while Michael Clarke thought it unfortunate that the toss had determined the result: "It's really hard, I hate to see a Test match result determined by the toss, but that was one of the toughest wickets I've played Test cricket on." Others believed the decision was too harsh, given that the pitch had produced such riveting cricket.
The match itself was a curious one. While there was indeed plenty of assistance for spinners on the opening day, even opening session, it didn't become unplayable as the game went along: Mahela Jayawardene scored 105 and Angelo Mathews 95 in the fourth innings, in which only one wicket fell to a spinner. Sri Lanka lost because of their limp first-innings display, in which they crumbled for 105.
Fast forward ten months to July 2012, and to another Test in Sri Lanka, this time one which drew no censure from the ICC. It didn't produce a result either: Pakistan scored 551 for 6, and Sri Lanka, coasting at 367 for 5 at lunch on the final day, were bowled out for 391. What the match did produce was the first instance of two batsmen scoring 190s in the same Test. Till lunch on the final day, the average runs per wicket in the match was 83.45, the third-highest ever in a Test in Sri Lanka (with a 200-over cut-off). By the end of the game, that average dropped to a still-meaty 56.40, the fifth-highest in a Test in Sri Lanka.
Admittedly, this was a Test in which Colombo's weather played its part too, ensuring that more than 150 overs were lost. Hence, it might be unfair to pull up the SSC and the pitch on this evidence alone. However, there's a trend here that deserves closer examination: of the 11 matches with highest batting averages in Sri Lanka, seven have been at the SSC. There've been 100 Tests with more than 200 overs in Sri Lanka, and 36 of them at the SSC; of those, 21 SSC Tests figure among the top 40 in terms of batting averages, while only 15 Tests at that ground feature in the other 60. (Click here for the full list of 100 Tests in Sri Lanka with 200-plus overs.)
It's clear that SSC has generally been a good venue for batting, but the recent record at the ground is even more skewed. Since the beginning of 2006, there've been ten Tests at the SSC, and in those matches, the average runs per wicket has been 46.12, with 32 centuries, and seven totals of more than 500 (including four of 600 or more). In terms of averages, it's easily the highest among the 23 venues which have hosted at least five Tests during this period; the draw percentage at this ground is 60 in these six-and-a-half years, in a phase when Test cricket the world over has generally yielded more results: the overall draw percentage in all Tests during this period is 28%; in Sri Lanka excluding the SSC, it's 24%. And yet, an SSC fixture is the most regular one on the Sri Lankan calendar: no other venue in the country has hosted as many Tests since 2006. Obviously, the ICC has seen no reason to react to the pitches that have been served up here.
| Venue | Tests | Results/ Draws | Runs per wkt | 100s/ 50s |
| SSC, Colombo | 10 | 4/ 6 | 46.12 | 32/ 49 |
| Adelaide Oval | 6 | 4/ 2 | 42.22 | 18/ 30 |
| McLean Park, Napier | 6 | 2/ 4 | 39.58 | 15/ 33 |
| Sydney Cricket Ground | 7 | 7/ 0 | 38.51 | 17/ 34 |
| Lord's | 14 | 7/ 7 | 37.91 | 36/ 69 |
| Kensington Oval, Barbdos | 5 | 3/ 2 | 37.67 | 8/ 29 |
On the other hand, Galle has been among the most bowler-friendly during this period, with an average of 30.63 runs per wicket. In nine Tests there have been seven results, and only 16 hundreds, exactly half the number of centuries that SSC has produced in ten. In terms of averages, only Trent Bridge and Wanderers has been more bowler-friendly.
Collectively, in the 68 Tests that have been played in the ten venues mentioned below, only six have been drawn. Contrast that with the corresponding stats for the six venues mentioned in the first table above: 21 draws in 48 Tests.
| Venue | Tests | Results/ Draws | Runs per wkt | 100s/ 50s |
| Wanderers, Johannesburg | 7 | 7/ 0 | 27.54 | 7/ 34 |
| Trent Bridge, Nottingham | 6 | 6/ 0 | 27.98 | 9/ 26 |
| Galle International Stadium | 9 | 7/ 2 | 30.63 | 16/ 39 |
| Melbourne Cricket Ground | 6 | 6/ 0 | 30.77 | 7/ 33 |
| Kingsmead, Durban | 7 | 7/ 0 | 30.84 | 16/ 30 |
| Basin Reserve, Wellington | 9 | 6/ 3 | 31.00 | 12/ 44 |
| WACA, Perth | 6 | 6/ 0 | 31.45 | 9/ 39 |
| SuperSport Park, Centurion | 7 | 6/ 1 | 31.80 | 12/ 30 |
| Headingley, Leeds | 5 | 5/ 0 | 31.82 | 10/ 16 |
| Seddon Park, Hamilton | 6 | 6/ 0 | 32.56 | 10/ 36 |
Among Sri Lankan venues too, the stats at the SSC stand out for their high scoring: since 2006, as many hundreds have been scored there in ten Tests as at all other Sri Lankan venues put together in 21 Tests. Also, there've been more draws there in ten matches (six) than in 21 Tests at the other Sri Lankan grounds (five). At the P Sara Oval, for instance, all six Tests have produced decisive results, and no team has touched 500 during this period.
| Venue | Tests | Results/ Draws | Runs per wkt | 100s/ 50s |
| SSC Colombo | 10 | 4/ 6 | 46.12 | 32/ 49 |
| Pallekele Int. Cricket Stadium | 2 | 0/ 2 | 38.87 | 2/ 8 |
| P Sara Oval, Colombo | 6 | 6/ 0 | 33.04 | 10/ 32 |
| R Premadasa Stadium, Colombo | 1 | 0/ 1 | 31.77 | 1/ 3 |
| Galle International Stadium | 9 | 7/ 2 | 30.63 | 16/ 39 |
| Asgiriya Stadium, Kandy | 3 | 3/ 0 | 28.86 | 3/ 12 |
The stats for Sri Lanka's top batsmen at the SSC and Galle reflect the pitch and conditions at the two grounds. At the SSC, both Mahela Jayawardene and Kumar Sangakkara average more than 100, while Thilan Samaraweera and Tillakaratne Dilshan have 65-plus averages. Jayawardene has scored 27% of his Test runs at just this one ground since 2006 (1415 out of 5211), while for Sangakkara the percentage is 23.
In Galle, on the other hand, three of these four batsmen average less than 50, with Jayawardene the only one to consistently score heavily. Before Sangakkara's unbeaten 199 against Pakistan in Galle last month, his Test average here was only 29.50 in 14 innings.
| Batsman | SSC-Tests | Runs | Average | 100s/ 50s | Galle-Tests | Runs | Average | 100s/ 50s |
| Mahela Jayawardene | 10 | 1415 | 101.07 | 5/ 5 | 9 | 1017 | 67.80 | 4/ 4 |
| Kumar Sangakkara | 10 | 1389 | 115.75 | 6/ 2 | 9 | 613 | 40.86 | 2/ 2 |
| Tillakaratne Dilshan | 9 | 732 | 66.54 | 2/ 4 | 9 | 718 | 47.86 | 2/ 5 |
| Thilan Samaraweera | 6 | 528 | 66.00 | 2/ 3 | 8 | 499 | 38.38 | 1/ 2 |
As you'd expect, there isn't much to cheer for the bowlers at the SSC, except if you're named Muttiah Muralitharan. Murali took 48 wickets at 17.68 in the six Tests he played here during this period, due to which the overall average of Sri Lankan spinners here is a highly respectable 29.04. Excluding his stats, the other Sri Lankan spinners average 39.94. Even that, though, is much better than what the overseas bowlers have managed here. (Click here for the list of highest wicket-takers in Tests at the SSC since January 2006.) The bowlers are a much happier lot in Galle, where both spinners and fast bowlers, from Sri Lanka and abroad, have respectable averages.
| SSC-Wkts | Average | Strike rate | Galle-Wkts | Average | Strike rate | |
| Sri Lanka - pace | 64 | 46.06 | 80.0 | 56 | 30.96 | 56.7 |
| Others - pace | 48 | 61.83 | 105.7 | 68 | 37.10 | 63.7 |
| Sri Lanka - spin | 98 | 29.04 | 62.3 | 97 | 26.32 | 54.7 |
| Others - spin | 48 | 63.43 | 118.0 | 59 | 36.66 | 69.9 |
S Rajesh is stats editor of ESPNcricinfo. Follow him on Twitter