Analysing the best batting pairs by partnership wicket
A detailed analysis of the most successful top-order and middle-order batting pairs
Since the late nineties, batting records have been especially dominated by India and Australia, who have had outstanding partnerships in the top order and middle order. England though, in recent times, boast the prolific opening pairing of Andrew Strauss and Alastair Cook, who have aggregated the most runs by an English opening pair in Tests. In the 2000s, Ricky Ponting and Matthew Hayden forged a terrific partnership for the second wicket to help sustain Australia's dominance while Sachin Tendulkar and Rahul Dravid did the same for India. The pair is all set to become the most prolific in Test history, requiring just 131 runs to go past the legendary West Indian opening partnership of Gordon Greenidge and Desmond Haynes. This piece aims to analyse in detail the performance of top batting pairs by partnership wicket and also point out a few interesting partnership-trends in various host countries.
Most successful teams in Test history were built on a solid foundation at the top of the innings. England's great pre-war pairing of Jack Hobbs and Herbert Sutcliffe remains the finest in terms of batting average and consistency (min 3000 runs aggregate). They shared 15 century stands in just 37 Tests and averaged over 80 both home and away. In wins, they were exceptional, with nine century stands at an average over 95. Furthermore, their performance across the four match innings has also been remarkably consistent, with their lowest average of 55.66 coming in the fourth innings. The Australian pairing of Bill Lawry and Bob Simpson was a highly successful combination in the 1960s aggregating over 3500 runs at an average of nearly 61.
India struggled without a good opening pair after the retirement of Sunil Gavaskar and Chetan Chauhan in the 1980s. The pair was very consistent both home and away, and did much better in the team second innings as compared to the first innings. Despite sharing ten century partnerships with Gavaskar, Chauhan himself never made a single hundred in Tests. The recent pairing of Virender Sehwag and Gautam Gambhir has been successful, but is yet to score substantially in away conditions. The pair has, however, been a huge factor in India's Test success in the last three years. Australia's dominance of world cricket from the mid 1990s until recently has largely been due to the presence of world-class opening pairs. After the end of the successful Michael Slater-Mark Taylor partnership in the 1990s, Hayden and Justin Langer continued to dominate bowling attacks. They shared 14 century stands including a record six 200-plus partnerships. However, they had very little to do in the third and fourth innings of matches given the strength of their bowling attack, and shared only two century stands in the team second innings.
The West Indian hegemony in the late 1970s and 1980s was largely due to an outstanding bowling attack, but their powerful batting line-up also had a lot to do with the unprecedented dominance. Greenidge and Haynes, who shared a record 16 century stands for the opening wicket were brilliant at home, but slightly less successful in away games. They averaged under 35 in Australia and England which can be attributed to a combination of the high quality opening bowling and sporting pitches in those years. Surprisingly, in sharp contrast to many other pairs, they did much better as the match progressed, and shared 15 of their 16 century partnerships in the second, third and fourth innings.
| Pair (Team) | Innings | Overall | Home | Away | Wins | 1st innings | 2nd innings | 3rd innings | 4th innings |
| Jack Hobbs, Herbert Sutcliffe (England) | 38 | 3249, 87.81, 15/10 | 2047, 93.04, 9/8 | 1202, 80.13, 6/2 | 1720, 95.55, 9/4 | 806, 89.55, 3/5 | 1512, 108.00, 7/3 | 597, 74.62, 3/1 | 334, 55.66, 2/1 |
| Bill Lawry, Bob Simpson (Australia) | 62 | 3596, 60.94, 9/18 | 1604, 59.40, 4/8 | 1992, 62.25, 5/10 | 1045, 69.66, 3/5 | 1283, 71.27, 2/6 | 873, 58.20, 3/2 | 1099, 64.64, 4/7 | 341, 37.88, 0/3 |
| Gautam Gambhir, Virender Sehwag (India) | 63 | 3551, 59.18, 10/19 | 2243, 62.30, 7/11 | 1308, 54.50, 3/8 | 1841, 68.18. 6/9 | 908, 56.75, 2/6 | 1417, 70.85, 5/6 | 790, 46.47, 2/4 | 436, 62.28, 1/3 |
| Chetan Chauhan, Sunil Gavaskar (India) | 59 | 3010, 53.75, 10/10 | 1402, 53.92, 5/5 | 1608, 53.60, 5/5 | 788, 56.28, 3/2 | 929, 48.89, 4/3 | 548, 34.25, 0/4 | 1031, 73.64, 5/1 | 502, 71.71, 1/2 |
| Matthew Hayden, Justin Langer (Australia) | 113 | 5655, 51.88, 14/24 | 3308, 56.06, 9/12 | 2347, 46.94, 5/12 | 3567, 46.32, 7/18 | 2554, 75.11, 8/8 | 1360, 46.89, 4/4 | 982, 39.28, 1/6 | 759, 36.14, 1/6 |
| Michael Slater, Mark Taylor (Australia) | 78 | 3887, 51.14, 10/16 | 2193, 57.71, 7/9 | 1694, 44.57, 3/7 | 2250, 62.50, 6/11 | 1437, 55.26, 4/6 | 928, 51.55, 2/5 | 902, 47.47, 3/4 | 620, 47.69, 1/1 |
| Gordon Greenidge, Desmond Haynes (WI) | 148 | 6482, 47.31, 16/26 | 3534, 65.44, 10/14 | 2948, 35.51, 6/12 | 3500, 49.29, 9/15 | 1156, 30.42, 1/6 | 2693, 54.95, 7/10 | 1242, 42.82, 4/3 | 1391, 66.23, 4/7 |
As the bowling quality declined in the early 2000s, the Australian batting feasted on the weak new-ball attacks around the world. Not even South Africa were able to pose much of a threat when they travelled to Australia. Langer and Ponting averaged nearly 80 for the second wicket, and an incredible 116.72 in away matches. Hayden and Ponting, the most prolific batting pair in wins, were far more dominant in home games (average 83.32) when compared to away matches (average 59.40). They were brilliant in the fourth innings, with four century stands at an average of 81.08. On comparing the stats of the two Australian pairs with those of Haynes-Richie Richardson and David Boon-Taylor, it becomes very clear that the fast bowling faced in the 1980s and 1990s was of a much higher standard than that in the early 2000s.
| Pair (team) | Innings | Overall | Home | Away | Wins | 1st innings | 2nd innings | 3rd innings | 4th innings |
| Justin Langer, Ricky Ponting (Australia) | 40 | 2790, 79.71, 12/12 | 1506, 62.75, 7/7 | 1284, 116.72, 5/5 | 2098, 95.36, 10/7 | 1236, 77.25, 6/5 | 729, 60.75, 2/4 | 430, 107.50, 2/1 | 395, 131.66, 2/2 |
| Matthew Hayden, Ricky Ponting (Australia) | 71 | 4734, 71.71, 16/22 | 2833, 83.32, 10/12 | 1901, 59.40, 6/10 | 3917, 83.34, 14/16 | 1117, 62.05, 3/5 | 1268, 70.44, 2/10 | 1376, 76.44, 7/3 | 973, 81.08, 4/4 |
| Desmond Haynes, Richie Richardson (WI) | 63 | 3187, 53.11, 10/12 | 1987, 64.09, 7/6 | 1200, 41.37, 3/6 | 1935, 71.66, 8/6 | 870, 48.33, 2/4 | 1448, 62.95, 4/5 | 464, 38.66, 2/2 | 405, 57.85, 2/1 |
| David Boon, Mark Taylor (Australia) | 63 | 2712, 45.20, 7/13 | 1356, 43.74, 3/6 | 1356, 46.75, 4/7 | 1721, 50.61, 5/9 | 843, 38.31, 1/7 | 659, 38.76, 2/1 | 787, 60.53, 2/4 | 423, 52.87, 2/0 |
While the Dravid-Tendulkar partnership is the most prolific for the third wicket, it is the Pakistan pairing of Mohammad Yousuf and Younis Khan that takes the honours for the highest average. In 20 innings, they aggregated 2020 runs at an average over 106 with six century stands. However, only 248 of those runs were scored in wins, which is highly indicative of the inconsistency of the rest of Pakistan's batting line-up and the placid nature of the pitches in the subcontinent. Hashim Amla and Jacques Kallis have been instrumental in South Africa's recent rise in the Test rankings, and have an excellent conversion rate from fifties to hundreds.
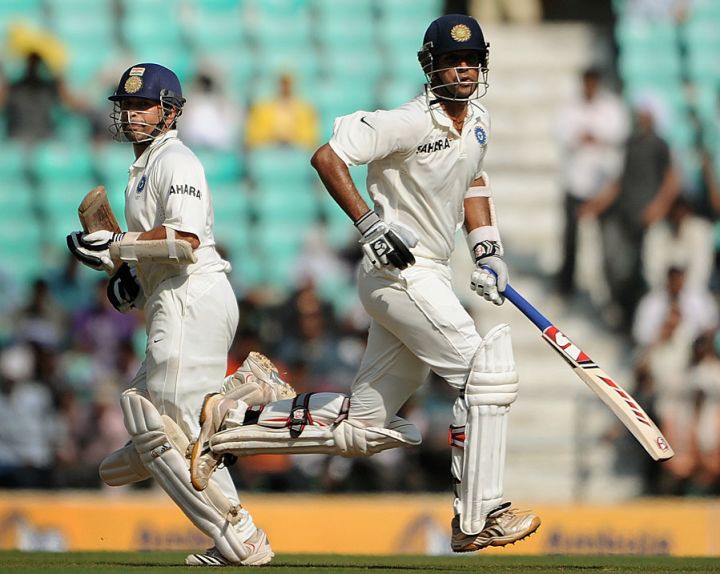
Mahela Jayawardene and Kumar Sangakkara, who have formed the core of the Sri Lankan middle order in the last few years average over 85 in home Tests but only 50 in away matches. Their numbers are exaggerated by their performances against Bangladesh and Zimbabwe, against whom they average over 81 in ten innings. In contrast, they have played Australia in just three innings and average close to 27. In a West Indian team that lost far more matches than it won, Brian Lara and Ramnaresh Sarwan were superb. They averaged over 60 and boasted an excellent conversion rate with ten century stands and four fifty partnerships. Tendulkar and Dravid share the most century stands for any batting pair, and have been a symbol of consistency for more than a decade. Their only blip, however, is an below-par performance in the fourth innings, where they average under 39.
| Pair (team) | Innings | Overall | Home | Away | Wins | 1st innings | 2nd innings | 3rd innings | 4th innings |
| Mohammad Yousuf, Younis Khan (Pakistan) | 20 | 2020, 106.31, 6/6 | 1046, 130.75, 4/2 | 974, 88.54, 2/4 | 248, 62.00, 1/1 | 634, 126.80, 2/2 | 704, 140.80, 2/2 | 533, 106.60, 2/1 | 149, 37.25, 0/1 |
| Hashim Amla, Jacques Kallis (SA) | 38 | 2558, 69.13, 8/5 | 1391, 73.21, 4/4 | 1167, 64.84, 4/1 | 1623, 85.42, 5/2 | 767, 85.22, 3/1 | 887, 59.13, 3/2 | 725, 145.00, 2/1 | 179, 22.37, 0/1 |
| Mahela Jayawardene, Kumar Sangakkara (SL) | 66 | 4485, 69.00, 12/18 | 2918, 85.82, 8/8 | 1567, 50.54, 4/10 | 2721, 100.77, 8/7 | 1116, 46.50, 2/6 | 2086, 104.30, 5/7 | 1179, 69.35, 5/4 | 104, 26.00, 0/1 |
| Alastair Cook, Kevin Pietersen (England) | 36 | 2106, 60.17, 8/10 | 1004, 50.20, 3/6 | 1102, 73.46, 5/4 | 998, 66.53, 4/5 | 843, 38.31, 1/7 | 632, 63.20, 2/5 | 831, 118.71, 5/2 | 28, 28.00, 0/0 |
| Brian Lara, Ramnaresh Sarwan (WI) | 38 | 2286, 60.15, 10/4 | 1092, 54.60, 5/2 | 1194, 66.33, 5/2 | 517, 86.16, 3/0 | 713, 64.81, 3/1 | 632, 63.20, 2/5 | 297, 29.70, 1/0 | 489, 81.50, 2/2 |
| Rahul Dravid, Sachin Tendulkar (India) | 109 | 5258, 50.55, 17/18 | 2478, 45.88, 7/7 | 2780, 55.60, 10/11 | 2436, 62.46, 9/10 | 1930, 50.78, 6/8 | 1481, 47.77, 6/2 | 1342, 61.00, 5/4 | 505, 38.84, 0/4 |
Jayawardene and Thilan Samaraweera, who average over 74 for the fourth wicket, have featured in just nine partnerships outside the subcontinent. Eight of their nine century stands have come in the subcontinent. Inzamam-ul-Haq and Yousuf have featured in 50 partnerships, and have an average of nearly 91 in wins. Mark Waugh and Steve Waugh, who put on 231 in Jamaica in 1995 to help Australia win their first series in the West Indies in 22 years, average just over 50 overall, but slightly over 66 in victories.
Steve Waugh, who has forged successful stands with Allan Border and Ponting for the fifth wicket, dominates the middle-order partnership stats. VVS Laxman and Rahul Dravid, who put on 376 runs against Australia in the unforgettable Kolkata Test in 2001, have an average of 67 with five century stands. Adam Gilchrist and Damien Martyn, who average over 75 for the sixth wicket, have been ordinary in home Tests. However, they average nearly 91 in away matches while scoring nearly 72% of their runs in wins. Ian Healy and Steve Waugh have aggregated the most runs for the sixth wicket, and have also featured in the most century stands (6).
| Pair (team) | Wicket | Innings | Overall | Home | Away | Wins |
| Mahela Jayawardene, Thilan Samaraweera (SL) | 4 | 33 | 2317, 74.74, 9/5 | 1208, 75.50, 5/3 | 1109, 73.93, 4/2 | 1003, 83.58, 5/2 |
| Sourav Ganguly, Sachin Tendulkar (India) | 4 | 44 | 2695, 64.16, 7/11 | 1220, 81.33, 3/4 | 1475, 54.62, 4/7 | 950, 86.36, 3/4 |
| Inzamam-ul-Haq, Mohammad Yousuf (Pakistan) | 4 | 50 | 2677, 58.19, 9/11 | 1390, 60.43, 4/6 | 1287, 55.95, 5/5 | 1180, 90.76, 4/6 |
| Mark Waugh, Steve Waugh (Australia) | 4 | 53 | 2515, 50.30, 7/12 | 1203, 52.30, 3/6 | 1312, 48.59, 4/6 | 1855, 66.25, 6/7 |
| Ricky Ponting, Steve Waugh (Australia) | 5 | 23 | 1649, 74.95, 6/5 | 919, 83.54, 4/2 | 730, 66.36, 2/3 | 866, 66.61, 3/3 |
| Rahul Dravid, VVS Laxman (India) | 5 | 23 | 1410, 67.14, 5/3 | 608, 67.55, 2/0 | 802, 66.83, 3/3 | 948, 105.33, 3/2 |
| Allan Border, Steve Waugh (Australia) | 5 | 23 | 1384, 65.90, 3/5 | 686, 57.16, 2/2 | 698, 77.55, 1/3 | 1084, 83.38, 3/3 |
| Adam Gilchrist, Damien Martyn (Australia) | 6 | 20 | 1351, 75.05, 4/3 | 171, 34.20, 0/1 | 1180, 90.76, 4/2 | 969, 74.53, 3/3 |
| Tony Greig, Alan Knott (England) | 6 | 30 | 1277, 42.56, 4/6 | 590, 49.16, 1/5 | 687, 38.16, 3/1 | 90, 15.00, 0/1 |
| Ian Healy, Steve Waugh (Australia) | 6 | 53 | 2170, 42.54, 6/6 | 1020, 46.36, 3/3 | 1150, 39.65, 3/3 | 1228, 51.16, 4/3 |
The table below features the best batting pairs in wins. Australia's dominance in recent years means that the presence of four Australian pairs in the top seven is not entirely surprising. The Hayden-Ponting combination has scored 3948 runs in wins (82.9%) and is followed by Hayden-Langer (62.6% in wins). Greenidge and Haynes scored 3500 runs in wins which is nearly 15% of the team runs in those matches. In terms of percentage of team runs in wins, rhe Hayden-Langer pairing comes next, with 11.94%.
| Pair (team) | Overall runs | Runs in Wins | % runs in wins | % team runs in wins |
| Matthew Hayden, Ricky Ponting (Aus) | 4765 | 3948 | 82.9 | 10.38 |
| Matthew Hayden, Justin Langer (Aus) | 6081 | 3808 | 62.6 | 11.94 |
| Gordon Greenidge, Desmond Haynes (WI) | 6482 | 3500 | 54.0 | 14.48 |
| Rahul Dravid, Sachin Tendulkar (India) | 6352 | 3067 | 48.3 | 10.94 |
| Mahela Jayawardene, Kumar Sangakkara (SL) | 4988 | 2808 | 56.3 | 11.62 |
| Justin Langer, Ricky Ponting (Aus) | 2671 | 2671 | 77.4 | 7.71 |
| Mark Waugh, Steve Waugh (Aus) | 2540 | 2540 | 73.9 | 7.40 |
Visiting opening pairs have generally struggled in Australia and England when compared to the home batsmen. Home openers average nearly 41 in Australia and England whereas overseas pairs average close to 33. However, visiting opening pairs have done better than home batsmen in India, New Zealand and Sri Lanka. For the second wicket, overseas pairs have not been able to match the home pairs in all countries except South Africa and New Zealand. South Africa, however, have been a very competitive side at home after their readmission to international cricket in 1991. Their average for wickets 1-6 is comfortably higher than those of visiting teams in the period from 1991-2011.
Among visiting batting pairs who have played a minimum of ten innings and scored atleast 500 runs in a particular country, the Waugh brothers have been the best. They average nearly 88 in England between 1993 and 2001 with four century stands. Hobbs and Sutcliffe are by far the best visiting pair in Australia, with 1292 runs at an average of 81. Greenidge and Haynes have scored over 900 runs in Australia but at a modest average of 34. Mike Atheron and Alec Stewart were impressive in the West Indies, aggregating 873 runs at 43.65. Geoff Boycott and Graham Gooch were the best overseas pair in India, with 520 runs at an average of 65. During the 1980s, at the peak of West Indian dominance, their top four pairs averaged 61, 57, 50 and 47 in Tests in West Indies while overseas pairs averaged 37, 35, 30 and 29.
| Wicket | Australia | England | India | New Zealand | Pakistan | South Africa | Sri Lanka | West Indies |
| 1 | 40.42, 33.94 | 41.77, 32.98 | 41.43, 41.61 | 32.22, 36.60 | 42.03, 35.12 | 36.95, 37.03 | 34.80, 39.10 | 43.62, 41.20 |
| 2 | 45.58, 36.89 | 43.05, 38.53 | 42.23, 39.41 | 34.21, 36.44 | 40.04, 35.95 | 33.38, 35.02 | 40.65, 36.03 | 44.78, 39.83 |
| 3 | 43.60, 38.63 | 43.32, 39.15 | 47.66, 42.34 | 34.17, 45.76 | 52.74, 42.10 | 40.96, 38.20 | 53.32, 42.16 | 46.35, 42.88 |
| 4 | 47.74, 36.85 | 43.13, 36.82 | 42.85, 38.09 | 35.05, 43.33 | 42.79, 38.14 | 38.76, 38.15 | 48.23, 39.92 | 51.47, 41.33 |
| 5 | 41.56, 33.10 | 35.51, 34.24 | 39.77, 38.31 | 30.49, 44.86 | 39.86, 39.09 | 31.44, 31.34 | 47.96, 34.20 | 41.85, 35.82 |
| 6 | 36.69, 28.79 | 34.33, 31.00 | 37.74, 34.93 | 29.38, 37.39 | 42.23, 31.30 | 29.72, 30.44 | 35.63, 39.04 | 35.78, 33.58 |
Madhusudhan Ramakrishnan is a sub-editor (stats) at ESPNcricinfo
Read in App
Elevate your reading experience on ESPNcricinfo App.