Anderson's all-round show the only new entry
An analysis of performances in the World Cup after the first semi-final of the World Cup
This analysis will be done at suitable points during the World Cup 2015 so that the readers can see the way the Performance tables evolve. As more matches get played the top performance mosaic changes and readers can identify with what happened in the past few days. The qualifying bar for inclusion moves higher as more matches get played.
One of the greatest World Cup matches finished sometime back. Many mistakes made but what a cracker of a match it was. It has to be admitted that while South Africa fought long and hard, they made no fewer than five fielding mistakes and if one of these had been completed successfully, they might have won the match. There is no doubt that the crowd played its part. Maybe South Africa should have gone all out to finish first in their group. Not that India gave them even a glimpse of that.
| SNo | Rating Pts | Year | ODI# | MatchIdx# | Batsman | For | Vs | Runs | Balls |
|---|---|---|---|---|---|---|---|---|---|
| 1 | 833 | 2015 | 3643 | 111 | MJ Guptill | New Zealand | Win | 237* | 163 |
| 2 | 579 | 2015 | 3616 | 100 | AB de Villiers | South Africa | Win | 162* | 66 |
| 3 | 573 | 2015 | 3612 | 100 | CH Gayle | West Indies | Zim | 215 | 147 |
| 4 | 469 | 2015 | 3641 | 111 | RG Sharma | India | Bng | 137 | 126 |
| 5 | 461 | 2015 | 3615 | 100 | TM Dilshan | Sri Lanka | Bng | 161* | 146 |
| 6 | 459 | 2015 | 3610 | 100 | S Dhawan | India | Saf | 137 | 146 |
| 7 | 454 | 2015 | 3636 | 100 | BRM Taylor | Zimbabwe | Ind | 138 | 110 |
| 8 | 448 | 2015 | 3623 | 100 | DA Warner | Australia | Afg | 178 | 133 |
| 9 | 442 | 2015 | 3624 | 100 | KJ Coetzer | Scotland | Bng | 156 | 134 |
| 10 | 428 | 2015 | 3634 | 100 | Mahmudullah | Bangladesh | Nzl | 128* | 123 |
South Africa had four scores of 30 runs and above while New Zealand had five such scores. That means there was no single great batting performance. So the table remains undisturbed. For the record, Grant Elliott's 84 notched up 331 rating points and led the pack.
| SNo | Rating Pts | Year | ODI# | MatchIdx# | Bowler | For | Vs | Analysis |
|---|---|---|---|---|---|---|---|---|
| 1 | 679 | 2015 | 3617 | 100 | MA Starc | Australia | Nzl | 9.0 - 0 - 28 - 6 |
| 2 | 598 | 2015 | 3607 | 100 | TG Southee | New Zealand | Eng | 9.0 - 0 - 33 - 7 |
| 3 | 493 | 2015 | 3617 | 100 | TA Boult | New Zealand | Aus | 10.0 - 3 - 27 - 5 |
| 4 | 445 | 2015 | 3600 | 100 | MR Marsh | Australia | Eng | 9.0 - 0 - 33 - 5 |
| 5 | 430 | 2015 | 3602 | 100 | Sohail Khan | Pakistan | Ind | 10.0 - 0 - 55 - 5 |
| 6 | 361 | 2015 | 3643 | 111 | TA Boult | New Zealand | Win | 10.0 - 3 - 44 - 4 |
| 7 | 355 | 2015 | 3616 | 100 | Imran Tahir | South Africa | Win | 10.0 - 2 - 45 - 5 |
| 8 | 348 | 2015 | 3640 | 111 | Imran Tahir | South Africa | Slk | 8.2 - 0 - 26 - 4 |
| 9 | 335 | 2015 | 3620 | 100 | Mohammad Irfan | Pakistan | Zim | 10.0 - 2 - 30 - 4 |
| 10 | 329 | 2015 | 3642 | 111 | JR Hazlewood | Australia | Pak | 10.0 - 1 - 35 - 4 |
This was not a great bowling match. Too many runs conceded. So the table remains undisturbed. The best performance was Morne Morkel's hard-fought 3 for 59, which gathered 237 rating points.
| SNo | Rating Pts | Year | ODI# | MatchIdx# | Player | For | Vs | Runs | Balls | Analysis |
|---|---|---|---|---|---|---|---|---|---|---|
| 1 | 700 | 2015 | 3612 | 100 | CH Gayle | West Indies | Zim | 215 | 147 | 6.0-0-35-2 |
| 2 | 579 | 2015 | 3615 | 100 | TM Dilshan | Sri Lanka | Bng | 161* | 146 | 8.0-0-35-2 |
| 3 | 496 | 2015 | 3600 | 100 | MR Marsh | Australia | Eng | 23 | 20 | 9.0-0-33-5 |
| 4 | 447 | 2015 | 3620 | 100 | Wahab Riaz | Pakistan | Zim | 54* | 46 | 9.4-1-45-4 |
| 5 | 434 | 2015 | 3611 | 100 | MM Ali | England | Sco | 128 | 107 | 10.0-0-47-2 |
| 6 | 403 | 2015 | 3627 | 100 | SC Williams | Zimbabwe | Ire | 96 | 83 | 9.0-0-72-3 |
| 7 | 364 | 2015 | 3634 | 100 | Shakib Al Hasan | Bangladesh | Nzl | 23 | 18 | 8.5-1-55-4 |
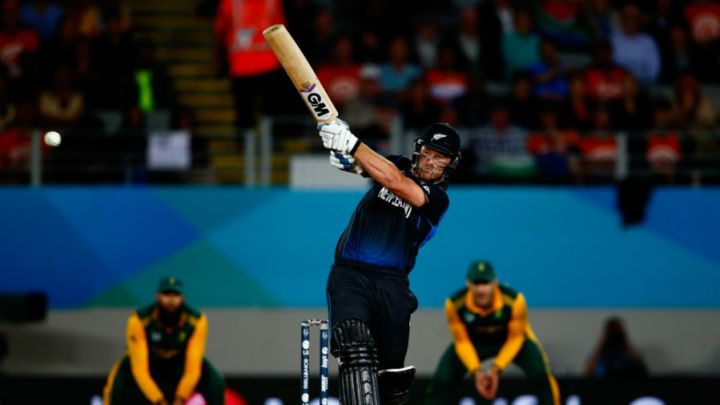
| 8 | 356 | 2015 | 3644 | 125 | CJ Anderson | New Zealand | Saf | 58 | 57 | 6.0-0-72-3 |
| 9 | 353 | 2015 | 3608 | 100 | AD Russell | West Indies | Pak | 42* | 13 | 8.0-2-33-3 |
| 10 | 344 | 2015 | 3638 | 100 | Amjad Javed | U.A.E. | Win | 56 | 99 | 8.0-0-29-2 |
At least one performance from today's match made the mark. That was Corey Anderson's 3 for 72 and 58 off 57 balls. This double, worthy of a man-of-the-match award, secured 356 rating points.
| SNo | Rating Pts | Year | ODI# | MatchIdx# | Team | Own score | Vs | Other score |
|---|---|---|---|---|---|---|---|---|
| 1 | 750 | 2015 | 3640 | 111 | South Africa | 134 for 1 in 18.0 | Slk | 133 for 10 in 37.2 |
| 2 | 721 | 2015 | 3616 | 100 | South Africa | 408 for 5 in 50.0 | Win | 151 for 10 in 33.1 |
| 3 | 714 | 2015 | 3607 | 100 | New Zealand | 125 for 2 in 12.2 | Eng | 123 for 10 in 33.2 |
| 4 | 690 | 2015 | 3610 | 100 | India | 307 for 7 in 50.0 | Saf | 177 for 10 in 40.2 |
| 5 | 688 | 2015 | 3623 | 100 | Australia | 417 for 6 in 50.0 | Afg | 142 for 10 in 37.3 |
| 6 | 678 | 2015 | 3621 | 100 | South Africa | 411 for 4 in 50.0 | Ire | 210 for 10 in 45.0 |
| 7 | 669 | 2015 | 3631 | 100 | India | 260 for 2 in 36.5 | Ire | 259 for 10 in 49.0 |
| 8 | 668 | 2015 | 3635 | 100 | England | 101 for 1 in 18.1 | Afg | 111 for 7 in 36.2 |
| 9 | 666 | 2015 | 3608 | 100 | West Indies | 310 for 6 in 50.0 | Pak | 160 for 10 in 39.0 |
| 10 | 664 | 2015 | 3618 | 100 | India | 104 for 1 in 18.5 | Uae | 102 for 10 in 31.3 |
The semi-final was a closely fought match and New Zealand could only secure 624 rating points. That was not enough to breach the top-10.
A brief introduction into the methodology of Performance Analysis.
The Batting Performance Ratings analysis takes into account the Runs scored, Balls faced, Next highest score (if this is the highest score), % of Team score, Innings status at entry, Bowling quality, Pitch information, Team strengths, Target score in front, Match location, Result and Match importance. These parameters are given appropriate weights. The calculations are done in such a way that Rating points of 1000 would be allotted to a mind-blowing and match-winning score of 200 in 150 balls in a WC final.
The Bowling Performance Ratings analysis takes into account the Wickets captured, Quality of batsmen dismissed, Scores at which batsmen were dismissed, Bowling accuracy, Batting quality, Pitch information, Team strengths, Target being defended, Match location, Result and Match importance. The calculations are done in such a way that Rating points of 1000 would be allotted to a magnificent and match-winning analysis of 10-2-15-6 in a WC final.
The Player Performance Ratings analysis takes into account the Batting Rating points, Bowling Rating points and the Fielding Rating points, which is a combination of catches and stumpings. There are minimum criteria for batting and bowling stints to ensure that these are genuinely all-round performances.
The Team Performance Ratings analysis takes into account the Result, Margin of win, Resources utilized, Team strengths, Match location and Match importance. The calculations are done in such a way that Rating points of 1000 would be allotted to an overwhelming win by 150 runs or 8 wickets in a WC final.
Anantha Narayanan has written for ESPNcricinfo and CastrolCricket and worked with a number of companies on their cricket performance ratings-related systems
Read in App
Elevate your reading experience on ESPNcricinfo App.