Australia's best strike bowler
He wasn't Australia's most consistent bowler, but when he was on top of his game he was unstoppable
The matchwinner
When he was at his best, there were few more compelling sights in cricket than Mitchell Johnson bowling at full pelt: he was among the quickest around, he bowled a fearsome bouncer, and his ability to intimidate was second to none. Consistency wasn't his strongest suit, but that unpredictability made him even more exciting to watch. He finishes as the fourth-highest wicket-taker in both Tests and ODIs for Australia, which in itself is tremendous given the number of high-quality bowlers who have played for Australia, but Johnson's biggest attribute wasn't just the number of wickets he took, but the number of games he won for Australia: in the last eight years (which is the duration of his Test career), no player won more Man-of-the-Match awards in Tests than Johnson - along with Kumar Sangakkara and Dale Steyn, he won nine, which is the highest during this period.
| Player | Tests | MoM awards |
| Mitchell Johnson | 73 | 9 |
| Kumar Sangakkara | 67 | 9 |
| Dale Steyn | 68 | 9 |
| Stuart Broad | 87 | 8 |
| Rangana Herath | 53 | 8 |
| James Anderson | 91 | 7 |
| Mahela Jayawardene | 61 | 7 |
| Daniel Vettori | 40 | 7 |
When Johnson bowled well, Australia usually won Test matches. Not only did he take plenty of wickets, he also took them quickly, giving the Australian batsmen plenty of time to overhaul the opposition totals to set up the wins. In the 39 Test wins that Johnson was involved in, he took 198 wickets at 21.72, whereas in defeats his average ballooned to 40.68.
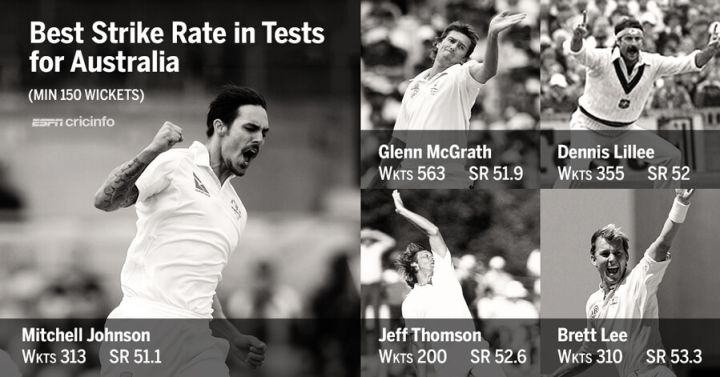
Johnson's strike rate of 42.2 in wins is even more impressive than his average, though. His tendency to always attack and look for wickets ensured that even though he went for a few runs, a dismissal was never far away. Among the 24 bowlers who have taken 100 or more wickets in wins since the beginning of 2000, only two - Steyn and Muttiah Muralitharan - have a better strike rate than Johnson's 42.2; among the 16 Australian bowlers who have taken at least 100 Test wickets in wins, only one - his idol Dennis Lillee - has a better strike rate. And his career strike rate of 51.1 balls per wicket is the best among the 21 Australian bowlers with at least 150 Test wickets, even though his average is only 14th among that lot.
| Match result | Tests | Wickets | Average | SR | 5WI |
| Wins | 39 | 198 | 21.72 | 42.2 | 9 |
| Losses | 22 | 70 | 40.68 | 67.5 | 2 |
| Draws | 12 | 45 | 38.68 | 64.7 | 1 |
| Player | Tests | Wickets | Average | SR | 5WI |
| Dennis Lillee | 31 | 203 | 18.27 | 39.0 | 17 |
| Mitchell Johnson | 39 | 198 | 21.72 | 42.2 | 9 |
| Jason Gillespie | 47 | 197 | 21.68 | 46.3 | 8 |
| Stuart MacGill | 31 | 165 | 24.40 | 46.5 | 12 |
| Glenn McGrath | 84 | 414 | 19.19 | 47.7 | 18 |
| Craig McDermott | 27 | 131 | 22.74 | 48.1 | 8 |
| Garth McKenzie | 18 | 112 | 19.49 | 49.0 | 9 |
| Peter Siddle | 27 | 110 | 22.39 | 49.1 | 4 |
| Brett Lee | 54 | 225 | 27.52 | 49.1 | 7 |
| Ray Lindwall | 33 | 138 | 19.13 | 50.8 | 8 |
The inconsistency
Johnson's highs touched stratospheric levels, but from time to time he also struggled to piece it all together, and his career lows were as infuriating as the highs were intoxicating. His finished with a career average that was closer to 30 than to 20, largely due to periods when form and confidence deserted him. In the period between July 2010 and the end of 2011, he leaked almost 46 runs per wicket over 13 Test matches, taking only 35 wickets. He also conceded 3.7 runs per over during this period, giving the team neither control nor wickets. In the five series he played during this period, be averaged more than 35 in four, and more than 50 in three.
When he returned to the team a year later, though, he found his mojo again, and over the next two years was at the top of his game. England were demolished in the home Ashes in 2013-14, and just to prove that wasn't a fluke performance, he repeated the dose in South Africa early in 2014. In those two series he took 59 wickets from just eight Tests, at an average of 15.23 and a strike rate of 32 balls per wicket. Nearly half the five-fors he took in his entire career came during this eight-Test period.
| Period | Tests | Wickets | Average | SR | 5WI |
| Till June 2010 | 34 | 155 | 28.03 | 52.1 | 5 |
| Jul 2010 to Dec 2011 | 13 | 35 | 45.71 | 74.1 | 2 |
| Jan 2012 to Jun 2015 | 19 | 101 | 20.60 | 40.0 | 5 |
| Jul 2015 onwards | 7 | 22 | 39.27 | 58.4 | 0 |
| Career | 73 | 313 | 28.40 | 51.1 | 12 |
| Less than 20 | 20 to 29.99 | 30 to 39.99 | 40 and over |
| 5 | 6 | 8 | 5 |
Johnson's overall career numbers also reveal an affinity for bouncy pitches, and an aversion for surfaces that were slower and offering less bounce. In 42 Tests in Australia and South Africa, Johnson claimed a rich bounty of 212 wickets - that's more than five wickets per Test - averaging 25.44 runs per wicket, about three runs better than his career average. In England and in Asia, though, those numbers dropped significantly: from 24 Tests, he took only 71 wickets - that's three per game - at an average of 38.36. His average in Asia was 40.36 from 12 Tests, which doesn't compare favourably with Steyn (average 22.66 from 20 Tests in Asia) or Anderson (28.29 in 17 Tests in Asia).
| Host country/ region | Tests | Wickets | Average | SR | 5WI |
| in Aus and SA | 42 | 212 | 25.44 | 46.3 | 9 |
| in Asia and Eng | 24 | 71 | 38.36 | 67.2 | 2 |
The best during his best years
Clearly, Johnson wasn't the most consistent fast bowler Australia have ever had, but at his best he was irresistible, and better than anyone else. Between 2012 and mid-2015, when Johnson was at the top of his game, his Test stats were better than any other bowler, pace or spin. In 19 Tests during this period, he averaged more than five wickets per match, and less than 21 runs per wicket. Among all bowlers with at least 50 wickets, the next-best average was Steyn's 21.88, while the best among spinners were Pragyan Ojha (24.96) and Yasir Shah (25.11).
| Player | Mat | Wkts | Average | Econ | SR | 5WI |
| Mitchell Johnson | 19 | 101 | 20.60 | 3.08 | 40.0 | 5 |
| Dale Steyn | 28 | 136 | 21.88 | 2.88 | 45.5 | 8 |
| Vernon Philander | 26 | 97 | 24.32 | 2.72 | 53.5 | 5 |
| Ryan Harris | 19 | 78 | 24.48 | 2.68 | 54.7 | 3 |
| Kemar Roach | 18 | 77 | 25.15 | 3.11 | 48.4 | 4 |
| Tim Southee | 26 | 104 | 27.33 | 2.85 | 57.5 | 3 |
| Trent Boult | 31 | 119 | 27.36 | 2.85 | 57.5 | 4 |
| James Anderson | 41 | 163 | 27.73 | 2.77 | 59.8 | 6 |
| Stuart Broad | 38 | 155 | 27.86 | 3.11 | 53.6 | 9 |
| Morne Morkel | 27 | 91 | 28.20 | 2.93 | 57.6 | 2 |
The head-to-head records
Johnson didn't have a preference in terms of bowling to right- or left-hand batsmen - he averaged 27.33 against right-hand batsmen and 28.33 against the lefties - but the list below shows he had a mixed record against some of the top batsmen he bowled to. He dominated Jacques Kallis, Kevin Pietersen, Graeme Smith, Ian Bell and Rahul Dravid, but didn't do so well against Kumar Sangakkara, Shivnarine Chanderpaul, Sachin Tendulkar, VVS Laxman and Mahela Jayawardene. He has dismissed Alastair Cook and AB de Villiers a fair number of times, but they've also scored runs against him. Among the next lot of top batsmen, Virat Kohli and Joe Root both average in the 40s against him, but Kane Williamson has been outstanding against him, scoring 138 runs from 134 balls, without being dismissed. All of those runs have come in the ongoing series - they had never played each other in a Test before.
| Batsman | Runs | Balls | Strike rate | Dismissals | Ave |
| Alastair Cook | 362 | 539 | 67.16 | 9 | 40.22 |
| Graeme Smith | 203 | 254 | 79.92 | 9 | 22.55 |
| Hashim Amla | 308 | 502 | 61.35 | 7 | 44.00 |
| Ian Bell | 166 | 376 | 44.15 | 7 | 23.71 |
| JP Duminy | 149 | 323 | 46.13 | 7 | 21.28 |
| AB de Villiers | 259 | 537 | 48.23 | 5 | 51.80 |
| Jacques Kallis | 88 | 269 | 32.71 | 5 | 17.60 |
| Jonathan Trott | 132 | 225 | 58.67 | 5 | 26.40 |
| Rahul Dravid | 113 | 324 | 34.88 | 4 | 28.25 |
| Kevin Pietersen | 113 | 207 | 54.59 | 4 | 28.25 |
| Joe Root | 174 | 394 | 44.16 | 4 | 43.50 |
| Virender Sehwag | 189 | 287 | 65.85 | 4 | 47.25 |
| Virat Kohli | 146 | 160 | 91.25 | 3 | 48.66 |
| Sachin Tendulkar | 250 | 502 | 49.80 | 3 | 83.33 |
| VVS Laxman | 196 | 289 | 67.82 | 2 | 98.00 |
| Kumar Sangakkara | 190 | 265 | 71.70 | 2 | 95.00 |
| Mahela Jayawardene | 75 | 210 | 35.71 | 1 | 75.00 |
| Kane Williamson | 138 | 134 | 102.99 | 0 | - |
| Shivnarine Chanderpaul | 114 | 205 | 55.61 | 0 | - |
The ODI bowler
Johnson's attacking style of bowling wasn't always the best recipe in ODIs, but the ability to take wickets came in handy in that format as well. Among all bowlers who have bowled at least 500 overs since the beginning of 2006 (which is the period when Johnson played 152 of his 153 ODIs), Johnson's average of 24.99 is sixth among all bowlers, and third among fast bowlers, after Morne Morkel and Nathan Bracken. The strike rate of 31.1 balls per wicket is fourth overall, with only Ajantha Mendis, Morne Morkel and Brett Lee doing better.
Surprisingly, Johnson did much better in Asia in this format than he did in Tests. His 84 wickets in Asia is the third-highest among non-Asian fast bowlers, next only to Courtney Walsh (94) and Heath Streak (85), while his bowling average of 21.89 in Asia is third among all bowlers who have bowled at least 250 overs in the continent. (There are 122 bowlers who make the cut.) The only ones better than him are Saqlain Mushtaq and Ajantha Mendis.
| Player | ODIs | Wkts | Average | Econ | SR |
| Saqlain Mushtaq | 90 | 167 | 20.58 | 4.36 | 28.2 |
| Ajantha Mendis | 63 | 114 | 21.21 | 4.80 | 26.5 |
| Mitchell Johnson | 46 | 84 | 21.89 | 4.75 | 27.6 |
| Saeed Ajmal | 70 | 116 | 21.93 | 4.07 | 32.3 |
| Brett Lee | 37 | 58 | 22.72 | 4.53 | 30.0 |
| Waqar Younis | 131 | 210 | 22.88 | 4.61 | 29.7 |
| Muttiah Muralitharan | 213 | 319 | 22.89 | 3.82 | 35.8 |
| Makhaya Ntini | 36 | 59 | 23.05 | 4.74 | 29.1 |
| Kyle Mills | 54 | 81 | 23.12 | 4.70 | 29.5 |
| Wasim Akram | 184 | 250 | 23.41 | 3.87 | 36.2 |
More numbers
2 Number of left-arm fast bowlers who took more Test wickets than Johnson; only Wasim Akram (414) and Chaminda Vaas (355) took more wickets. Also, the number of times Johnson won the ICC Player of the Year award; the only other player to win it more than once is Ricky Ponting (also twice).
37 Wickets Johnson took in the 2013-14 Ashes series - the most by a fast bowler in an Ashes series since Terry Alderman (41) in 1989.
13.97 Johnson's bowling average in the 2013-14 Ashes series - the fourth-best for any bowler who bowled at least 120 overs in an Ashes series.
2065 Test runs by Johnson in addition to his 313 wickets; he is one of the only two Australia players, and one of the 13 overall, with 2000 runs and 300 wickets in Tests.
8/61 Johnson's bowling figures in the first innings of the Perth Test in 2008 - the best figures ever by a left-arm fast bowler in a Test innings.
64 Wickets by Mitchell Johnson against South Africa in Tests - equals the highest by any fast bowler against them since their return to Test cricket.
80 Wickets by Mitchell Johnson in the fourth innings of Tests in just 39 innings - the second-highest by any fast bowler after Glenn McGrath's 103 wickets.
With inputs from Shiva Jayaraman.
S Rajesh is stats editor of ESPNcricinfo. @rajeshstats
Read in App
Elevate your reading experience on ESPNcricinfo App.