Nightmare for touring teams
West Indies won five Tests in Perth, but the other overseas teams have a 4-20 win-loss record here
India won the only Test they have played in Perth in the last 20 years, and yet they will be underdogs going into the third Test. Australia's grip on the series has strengthened with every day of the two Test matches so far, and they will also take confidence from their most recent result at the WACA: during the disastrous Ashes campaign in 2010-11, the 267-run thrashing of England in Perth was their only victory.
Over the previous decade, the WACA hasn't been the most successful venue for Australia - they won six Tests and lost two here, while they've done better at most home grounds - but the promise of pace and bounce against a team from the subcontinent immediately shifts the odds in favour of the home team.
Overall, Perth has hosted 38 Tests, of which only seven have been drawn. The draw percentage here is 18, the third-lowest among all grounds which have hosted at least 25 Tests. Taking a 1990 cut-off, with a minimum of ten Tests, the draw percentage drops to 14, again the third-lowest.
The only team other than Australia to relish conditions in Perth was West Indies, back in the 1970s, '80s and '90s. Despite losing the toss in each of their seven Tests in Perth, West Indies won five, three of them by an innings and another by ten wickets. Leave West Indies out of it, and overseas teams have a 4-20 win-loss record.
One of the features of the venue has been the huge victory margins: 11 out of the 31 decisive Tests have been innings victories, six more by margins of 200 or more, and four by eight or more wickets. In the previous 17 Tests, since 1995, only two have been drawn, and of the 15 decisive Tests, there've been six innings wins, a ten-wicket result, and victories by 329, 491 and 267 runs.
| Tests | Won | Lost | Drawn | |
| Australia, overall | 38 | 22 | 9 | 7 |
| Australia, since 1995 | 17 | 12 | 3 | 2 |
| India, overall | 3 | 1 | 2 | 0 |
Fast bowlers have traditionally been known to get plenty of assistance on this pitch, and yet the average runs per wicket in the first innings of Tests over the last decade is a pretty impressive 41.63. That, though, is slightly misleading, and propped up by three huge totals, a couple of them against relatively weak opposition: Australia scored 735 for 6 and 520 for 7 versus Zimbabwe and West Indies, while New Zealand made 534 for 9 against Australia in 2001. In seven other Tests, the highest first-innings total is 381.
The second innings has been a huge struggle here, though: in ten innings, only twice have teams topped 350; in the last eight innings, the highest is 312. In the third and fourth innings, the averages go up into the 30s.
| 1st inngs | 2nd inngs | 3rd inngs | 4th inngs |
| 41.63 | 27.28 | 38.68 | 34.69 |
Over the previous decade (since January 2001), Australia won six and lost two Tests in Perth, and that dominance is reflected in the batting stats. While Australia batsmen averaged more than 40 in these ten Tests, overseas batsmen averaged 27, a difference of 13. The difference is pretty significant, though not as much as those in Brisbane or Hobart.
The other stat that stands out in the table below is the conversion rate at this ground: since 2001, out of 83 fifty-plus scores, only 18 have been converted into hundreds, a percentage of 21.69. It's easily the least among the six regular Test grounds in Australia during this period. Getting hundreds has been particularly difficult for Australia batsmen, who have a conversion rate of 19%, compared to 25% for overseas batsmen. Ricky Ponting's record illustrates that problem: he has scored six Test fifties here, but only one century.
| Venue | Tests | Overall ave | 100s/ 50s | Aus batsmen - Ave | 100s/ 50s | Away batsmen - ave | 100s/ 50s |
| Adelaide | 10 | 38.10 | 26/ 54 | 43.87 | 14/ 32 | 33.52 | 12/ 22 |
| Sydney | 14 | 36.44 | 37/ 67 | 41.73 | 23/ 28 | 32.26 | 14/ 39 |
| Brisbane | 11 | 34.99 | 27/ 52 | 50.45 | 21/ 29 | 25.07 | 6/ 23 |
| Hobart | 5 | 33.38 | 14/ 19 | 46.62 | 10/ 9 | 24.40 | 4/ 10 |
| Perth | 10 | 33.26 | 18/ 65 | 40.46 | 9/ 38 | 27.11 | 9/ 27 |
| Melbourne | 11 | 31.19 | 19/ 56 | 37.53 | 14/ 29 | 26.15 | 5/ 27 |
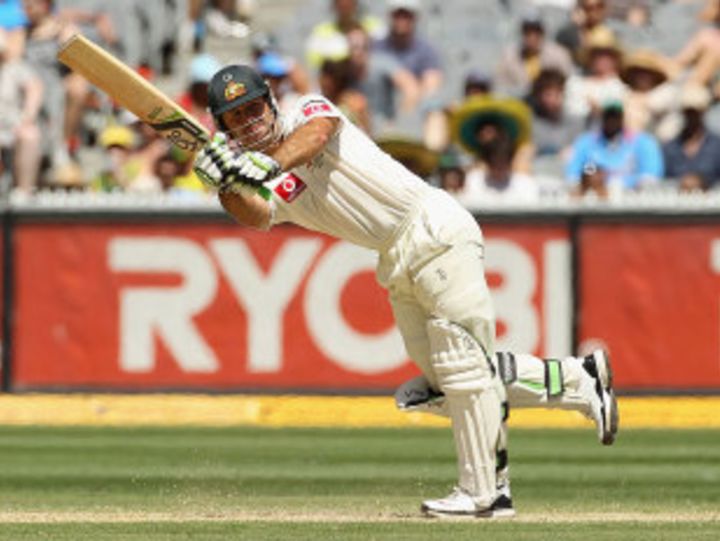
Among the current Australia batsmen who've played Tests here, Michael Hussey has the best average, which isn't surprising considering this is his home ground: in 12 innings he averages more than 53 with two hundreds, including one in the Ashes Test here in 2010-11. Ponting averages a respectable 43 in 23 innings, but his recent performances here haven't been that inspiring: his last seven completed innings have fetched only 135. Ponting requires 54 runs to become the first cricketer to score 1000-plus Test runs at five venues, but he'll have to do a little better than his recent performances here to reach that mark. Michael Clarke has had a bit of a lean period too, with no knock of more than 25 in his last five innings here.
For India, Sachin Tendulkar is the only one from the current squad to have played more than one Test here: in his first tour to Australia in 1991-92, he impressed one and all with his stunning 114, and then he made a more measured 71 in 2008.
| Batsman | Tests | Runs | Average | 100s/ 50s |
| Michael Hussey | 6 | 588 | 53.45 | 2/ 4 |
| Brad Haddin | 3 | 311 | 51.83 | 0/ 3 |
| Ricky Ponting | 15 | 946 | 43.00 | 1/ 6 |
| Michael Clarke | 6 | 451 | 41.00 | 1/ 2 |
Fast bowlers clearly lead the way at this ground, but the table below suggests that overseas fast bowlers tend to lose the plot when bowling on this bouncy pitch. Australia fast bowlers, since the beginning of 2001, have an average of 25.74 here, with Mitchell Johnson having an especially outstanding record.
Overseas fast bowlers have struggled, though - their overall average is almost 43. Spinners from all lands haven't contributed a whole lot here, though Monty Panesar and Daniel Vettori have taken five-fors. Even Shane Warne didn't find it easy, taking only 19 wickets in five Tests at almost 36 apiece.
| Overall - wkts | Average/ SR | Aus - wkts | Average/ SR | Overseas - wkts | Average/ SR | |
| Pace | 257 | 33.10/ 59.0 | 147 | 25.74/ 52.5 | 110 | 42.94/ 67.6 |
| Spin | 68 | 43.83/ 78.1 | 29 | 43.44/ 89.2 | 39 | 44.12/ 69.8 |
S Rajesh is stats editor of ESPNcricinfo. Follow him on Twitter
Read in App
Elevate your reading experience on ESPNcricinfo App.