Ball trumps bat, Kohli tops Rabada
Stats highlights from a riveting three-Test series, in which the ball thoroughly dominated bat
If India are playing South Africa in a Test series, it must be bounty time for bowlers, and a nightmare for batsmen. At least that's what it looks like from the last two series between these teams. When South Africa toured India in 2015-16, the overall batting average in the series was 20.04; this time it was 21.80. These are the two lowest numbers for runs per wicket in a series of three or more Tests in the last 30 years. The last time a series produced a lower average was in 1986, when West Indies' tour of Pakistan - a series made famous for the use of two neutral umpires - produced 19.32 runs per wicket.
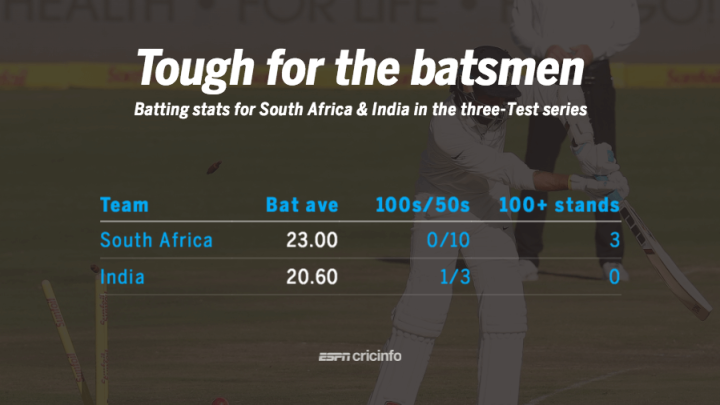
The batsmen from both teams had a tough time in this series. Virat Kohli was the only centurion, but South Africa had three century stands to none for India. In fact, this is only the fifth time India have gone through an entire series without a century stand (with a cut-off of 50 partnerships in the series). The last two times it happened were in England in 1971 and 1986, when India ended up winning those series.
Pace on top
In the 2015-16 series in India, the spinners flourished on rank turners, averaging 17.24 runs per wicket, the best in any series of three or more Tests in the last 59 years. This time, the fast bowlers were utterly dominant, averaging 20.49 runs per wicket. Only once in the last 30 years, have fast bowlers conceded fewer runs per wicket in a series of three or more Tests: in the Pakistan-West Indies series in 1990-91, when the list of quicks included Curtly Ambrose, Ian Bishop, Malcolm Marshall, Courtney Walsh, Wasim Akram, Waqar Younis and Imran Khan, the fast bowlers averaged 18.55 runs per wicket.
India's big success in this series was the performance of their fast bowlers, who took 50 wickets at 22.48, compared to South Africa's 56 wickets at 18.71. When compared to the 2015-16 series, it is clear that India's pace attack did much better in South Africa than South Africa's spinners did in India.
| Team | Wkts | Ave | SR |
| South Africa | 56 | 18.71 | 40.6 |
| India | 50 | 22.48 | 45.9 |
| Team | Wkts | Ave | SR |
| India | 61 | 11.93 | 34.8 |
| South Africa | 34 | 26.76 | 50.5 |
For India's pace attack, this was a rare series. For only the third time in their Test history, India's fast bowlers took 50 or more wickets in a series; the two previous instances were both in series of five or more Tests - versus Pakistan in 1979-80, and in Australia in 1991-92. Kapil Dev was the leading wicket-taker in both series. In a three-Test series, the previous highest for India's pace attack was 41 wickets, in England in 1986 and 2007, and in South Africa in 1996-97.
| Series | Mat | Wkts | Ave | SR |
| Pak in Ind, 1979-80 | 6 | 58 | 27.25 | 53.1 |
| Ind in Aus, 1991-92 | 5 | 57 | 33.77 | 79.6 |
| Ind in SA, 2017-18 | 3 | 50 | 22.48 | 45.9 |
| WI in Ind, 1978-79 | 6 | 45 | 27.66 | 49.8 |
| Ind in Eng, 2014 | 5 | 45 | 43.00 | 72.7 |
| Ind in Eng, 1986 | 3 | 41 | 22.56 | 51.2 |
| Ind in SA, 1996-97 | 3 | 41 | 31.29 | 54.5 |
| Ind in WI, 2002 | 5 | 41 | 42.65 | 93.3 |
| Ind in Eng, 2007 | 3 | 41 | 27.21 | 54.1 |
| Ind in Aus, 2014-15 | 4 | 41 | 49.97 | 69.6 |
In terms of averages, India's pace average of 22.48 is their third best in a series in which they have at least 150 overs. The two series when they did better was in 2002-03 in New Zealand, when the pitches were similarly seamer-friendly, and in West Indies in 2011, when Ishant Sharma led the way with 22 wickets in three Tests.
In the entire series, only eight out of 114 wickets went to the spinners - seven to R Ashwin and one to Keshav Maharaj. The percentage of 7.02 is the second lowest in any three-Test series in South Africa, and the 10th lowest in any country. The most extreme case of pace domination was in the 1989-90 England tour of West Indies: in four Tests in that series, the fast bowlers took 126 wickets, and the spinners took none.
| Series | Mats | spin wks | bow wkts | %age |
| v Aus, 1902-03 | 3 | 2 | 97 | 2.06 |
| v Ind, 2017-18 | 3 | 8 | 114 | 7.02 |
| v NZ, 2000-01 | 3 | 6 | 80 | 7.5 |
| v NZ, 2006 | 3 | 8 | 95 | 8.42 |
| v NZ, 1922-23 | 5 | 14 | 164 | 8.54 |
The control factor
With conditions so heavily in favour of the bowlers, all the batsmen had a tough time negotiating the pace, the awkward bounce, and the seam and swing movement. The overall control percentage - the number of deliveries that the batsmen middled or left alone - was only 75.6, which is the lowest among all series of three or more Tests in the last ten years (since Boxing Day 2007). South Africa were only marginally ahead of India on this parameter - their batsmen achieved a control percentage of 76.6, compared to India's 74.4. In the 2015-16 India-South Africa series, the in-control stat was relatively higher at 82.9%.
| Series | Mats | In-control % |
| Ind in SA, 2017-18 | 3 | 75.6 |
| NZ in Eng, 2008 | 3 | 78.8 |
| Aus in SL, 2016 | 3 | 78.9 |
| The Ashes, 2009 | 5 | 78.9 |
| SA in Eng, 2017 | 4 | 79.4 |
| The Ashes, 2015 | 5 | 79.6 |
Several batsmen from both teams had control percentages of around 80, but some of them made better use of the deliveries when they were in control. Kohli, for example, had a control percentage of 79.8, but he also scored at a strike rate of 62.5 off those deliveries, which meant he ended up with the most runs and highest average among batsmen from either team. Cheteshwar Pujara and M Vijay, on the other hand, had similar control percentages, but their strike rates off those in-control deliveries were much lower, which meant they struggled to score runs.
| Batsman | Control % | Control SR | Series ave |
| Virat Kohli | 79.8 | 62.5 | 47.66 |
| Ajinkya Rahane | 68.4 | 70.7 | 28.50 |
| Rohit Sharma | 80.5 | 38.5 | 19.50 |
| Murali Vijay | 81.3 | 27.8 | 17.00 |
| Cheteshwar Pujara | 80.1 | 30.5 | 16.66 |
| KL Rahul | 82.2 | 26.5 | 7.50 |
For South Africa, AB de Villiers had similar stats in terms of control percentage and strike rate, but the numbers for their openers are the most interesting. Dean Elgar has a relatively low control percentage, didn't score too quickly, but still ended up with excellent series numbers. According to ESPNcricinfo's ball-by-ball stats, he was not in control of 134 deliveries, but was dismissed only five times, a rate of 27 such deliveries per dismissal (the series average was around 11 not-in-control deliveries per dismissal). His partner Aiden Markram, on the other hand, had an extremely high control percentage of 88.5 - the highest among all batsmen in the series - but got out six times in the 26 deliveries that he was not in control, which is an average of one dismissal per 4.3 such balls. It is true that all not-in-control deliveries are not equal in terms of the danger of being dismissed, but Markram can take confidence from the fact that he certainly didn't look out of place playing in such tough conditions so early in his career.
| Batsman | Control % | Control SR | Series ave |
| Dean Elgar | 75.2 | 39.0 | 41.40 |
| AB de Villiers | 80.9 | 72.2 | 35.16 |
| Hashim Amla | 83.5 | 48.5 | 33.83 |
| Faf du Plessis | 81.1 | 46.8 | 30.50 |
| Aiden Markram | 88.5 | 65.2 | 23.33 |
| Quinton de Kock | 65.4 | 96.0 | 11.83 |
Head-to-head battles
Kohli v Rabada was one of the big battles of the series. Kohli comfortably won that battle, scoring 93 runs off 147 balls, and being dismissed just once. Kohli had an 80% in-control stat against him, but in terms of overall numbers, Rabada clearly finished second best. He did have a good time against Rohit and Vijay, though, dismissing them three times each. Philander, meanwhile, was outstanding against India's openers, dismissing both Vijay and Rahul twice each, and collectively conceding only 33 runs to them off 161 balls.
| Batsman | Bowler | Runs | Balls | Dis | Ave |
| HH Pandya | K Rabada | 12 | 33 | 3 | 4.00 |
| RG Sharma | K Rabada | 27 | 52 | 3 | 9.00 |
| M Vijay | K Rabada | 19 | 86 | 3 | 6.33 |
| CA Pujara | M Morkel | 15 | 79 | 2 | 7.50 |
| AM Rahane | M Morkel | 25 | 38 | 2 | 12.50 |
| KL Rahul | VD Philander | 6 | 51 | 2 | 3.00 |
| M Vijay | VD Philander | 27 | 105 | 2 | 13.50 |
| V Kohli | K Rabada | 93 | 147 | 1 | 93.00 |
Against South Africa's top order, Jasprit Bumrah was extremely effective, dismissing each of du Plessis, de Villiers and de Kock three times, at averages of less than 20. Elgar escaped his clutches, despite a control percentage of only 74 against him. Ishant Sharma's had du Plessis' number, while Bhuvneshwar was superb against both the South African openers.
| Batsman | Bowler | Runs | Balls | Dis | Ave |
| Q de Kock | JJ Bumrah | 24 | 25 | 3 | 8.00 |
| AB de Villiers | JJ Bumrah | 58 | 111 | 3 | 19.33 |
| F du Plessis | JJ Bumrah | 50 | 91 | 3 | 16.66 |
| HM Amla | JJ Bumrah | 55 | 100 | 2 | 27.50 |
| F du Plessis | I Sharma | 7 | 55 | 2 | 3.50 |
| D Elgar | B Kumar | 28 | 91 | 2 | 14.00 |
| AK Markram | B Kumar | 22 | 38 | 2 | 11.00 |
| D Elgar | JJ Bumrah | 57 | 132 | 0 | - |
S Rajesh is stats editor of ESPNcricinfo. @rajeshstats
Read in App
Elevate your reading experience on ESPNcricinfo App.