Best series ever for Indian spinners
South Africa set new records for slow batting, while India's spinners raised the bar even higher over the four Tests
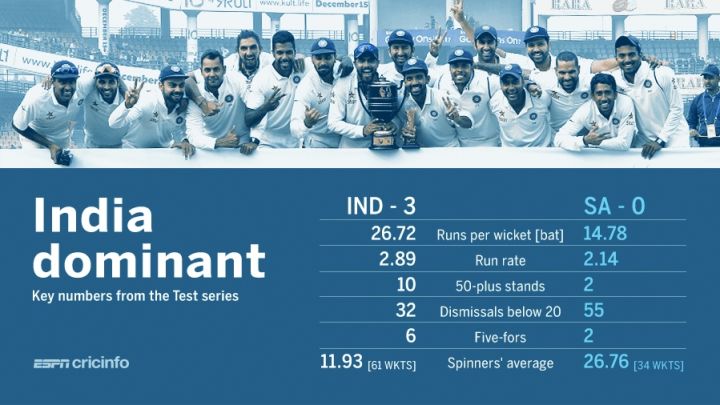
South Africa outplayed
The overall series numbers indicate just how comprehensive India's dominance was. Their batting average was 1.8 times South Africa's, with two centuries and four fifties compared to just two fifties for South Africa. Five different Indian batsmen passed 50 at least once in the series, while AB de Villiers was the only South African to do so, scoring 63 in Mohali and 85 in Bangalore. Among the top five run-getters in the series, de Villiers was the only South African.
Similarly, India were unchallenged in the bowling charts too. Their two leading wicket-takers were well clear of South Africa's best: R Ashwin had 31 scalps and Ravindra Jadeja 23, while Imran Tahir's 14 was the highest for South Africa.
| Team | Runs scored | Wkts taken | Bat ave | Run rate | 100s/ 50s |
| India | 1470 | 70 | 26.72 | 2.89 | 2/ 4 |
| South Africa | 1035 | 55 | 14.78 | 2.14 | 0/ 2 |
South Africa's batting average of 14.78 runs per wicket is their lowest in a series in more than a century. The last time they averaged fewer runs per wicket in a series was in 1912 - 12.81 runs per wicket in England. Since their readmission, their lowest before this series was 23.55, in the home series against Australia in 1996-97.
| Series | Mat | Won | Lost | Average | Run rate |
| South Africa in India, 2015-16 | 4 | 0 | 3 | 14.78 | 2.14 |
| Australia in South Africa, 1996-97 | 3 | 1 | 2 | 23.55 | 2.72 |
| South Africa in West Indies, 1991-92 | 1 | 0 | 1 | 24.65 | 2.36 |
| South Africa in Australia, 1993-94 | 3 | 1 | 1 | 24.83 | 1.99 |
| Australia in South Africa, 2005-06 | 3 | 0 | 3 | 25.45 | 3.14 |
South Africa's batsmen struggled to score runs, but spent long periods at the crease: 81% of the deliveries they played were dot balls, with Hashim Amla and Faf du Plessis playing 88% dots. Amla faced 576 deliveries and scored only 118 runs and his strike rate of 20.48 is the lowest among South African top-order batsmen who batted at least five times in a series. The previous-lowest during this period was Jacques Kallis' 20.58 in the home series against Australia in 1996-97, when he scored 49 runs from 238 balls.
| Batsman | Series | Inngs | Runs | Balls | Ave | SR |
| Hashim Amla | SA in Ind, 2015-16 | 7 | 118 | 576 | 16.85 | 20.48 |
| Jacques Kallis | Aus in SA, 1996-97 | 5 | 49 | 238 | 9.80 | 20.58 |
| Peter Kirsten | Ind in SA, 1992-93 | 7 | 76 | 369 | 12.66 | 20.59 |
| Faf du Plessis | SA in Ind, 2015-16 | 7 | 60 | 284 | 8.57 | 21.12 |
| Mark Boucher | Aus in SA, 2008-09 | 5 | 62 | 250 | 12.40 | 24.80 |
The partnership comparisons
South Africa had trouble putting together partnerships - in terms of runs - throughout the series. The highest their first two wickets could put on, in 14 attempts, was only 44. They batted long periods without scoring, which is reflected in an average run rate of 1.20 for the second wicket, 1.70 for the third, and 1.81 for the fifth. India had ten 50-plus stands, compared to just two for South Africa. The 154 runs that Ajinkya Rahane and Virat Kohli added in Delhi was the only century partnership of the series.
| India | South Africa | |||||
| For wkt | Average | Run rate | 100/50 stands | Average | Run rate | 100/ 50 stands |
| 1st | 30.16 | 2.74 | 0/ 2 | 13.42 | 2.11 | 0/ 0 |
| 2nd | 41.33 | 2.92 | 0/ 2 | 9.42 | 1.20 | 0/ 0 |
| 3rd | 31.16 | 2.85 | 0/ 1 | 23.28 | 1.70 | 0/ 1 |
| 4th | 23.33 | 3.13 | 0/ 1 | 19.28 | 2.00 | 0/ 0 |
| 5th | 27.16 | 2.52 | 1/ 0 | 19.00 | 1.81 | 0/ 1 |
| 6th | 26.40 | 3.08 | 0/ 1 | 21.28 | 2.81 | 0/ 0 |
| 7th | 26.20 | 3.00 | 0/ 1 | 20.00 | 3.38 | 0/ 0 |
| 8th | 38.60 | 2.95 | 0/ 1 | 7.71 | 3.11 | 0/ 0 |
Spin win
R Ashwin and Ravindra Jadeja were so completely dominant that apart from de Villiers, none of the South African batsmen had good stats against either of them. De Villiers averaged 42.50 against Ashwin and 31.33 against Jadeja. Amla averaged 16 against Ashwin and 8.33 against Jadeja. De Plessis averaged 6.25 against Jadeja and 8 against Ashwin.
Overall, India's spinners took 61 wickets at a stunning average of 11.93, their best by far in any series.
| Series | Tests | Wickets | Average | SR | 5WI |
| SA in Ind, 2015-16 | 4 | 61 | 11.93 | 34.8 | 6 |
| SL in Ind, 1986-87 | 3 | 34 | 15.97 | 36.8 | 2 |
| SL in Ind, 1993-94 | 3 | 44 | 16.65 | 46.3 | 3 |
| NZ in Ind, 1988-89 | 3 | 47 | 17.97 | 56.4 | 2 |
| NZ in Ind, 1995-96 | 3 | 20 | 18.55 | 51.1 | 2 |
S Rajesh is stats editor of ESPNcricinfo. @rajeshstats
Read in App
Elevate your reading experience on ESPNcricinfo App.