A feast of fifties, a struggle for spinners
Key numbers from the 2017 Champions Trophy, including a comparison with the most recent World Cup in Australia
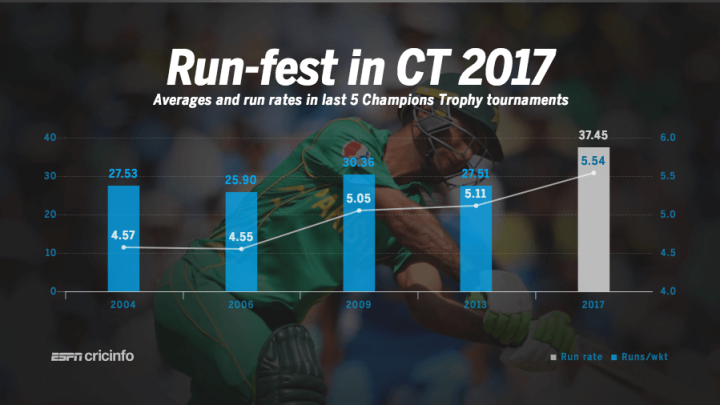
5.54 The run rate in the 2017 Champions Trophy, the highest among the eight editions so far. The next best, incidentally, was in the inaugural edition in Bangladesh in 1998, when teams scored at 5.29 runs per over. In the 2013 Champions Trophy, also hosted by England, the run rate was 5.11, while in the 2004 edition in England it was 4.57. Though there were key performances by bowlers in the tournament this year, batsmen held sway for the most part, as has been the norm in recent ODIs.
37.45 Runs per wicket in the 2017 edition, also the highest among all Champions Trophy editions. It is almost ten runs per wicket higher than the 2013 average of 27.51. There were 52 fifty-plus scores in 239 batsman-innings in 2017 - an average of one every 4.6 innings - compared to 35 from 267 innings in 2013 (one every 7.63 innings).
113 Sixes struck in this tournament, at an average of one every 67.9 balls, compared to 68 in 2013 at an average of 103.1 balls per six.
4-9 Win-loss record for teams batting first, the worst among all eight editions of the Champions Trophy. Three of the first four completed games were won by teams batting first, but they lost each of the next eight matches, before Pakistan won the final by a whopping 180 runs.
0.11 The difference in run rates between the 2015 World Cup and the 2017 Champions Trophy. The World Cup had a scoring rate of 5.65, while the Champions Trophy was marginally lower at 5.54. In both cases, the rates increased significantly from their previous editions four years ago: the 2011 World Cup had a rate of 5.03, and the 2013 Champions Trophy 5.11. In fact, these are the only two global ODI tournaments where the scoring rates have exceeded 5.5 runs per over.
A comparison of a couple of other key batting numbers indicate that while 50-plus scores were made at a greater frequency in this edition of the Champions Trophy, sixes were hit with more regularity in the 2015 World Cup - one six was smashed every nine overs in the World Cup in Australia, compared to one every 11.2 overs in the Champions Trophy in England.
71.9 The average runs per wicket for teams batting first in the first ten overs of the 2017 Champions Trophy. Overall, only ten wickets were lost in 15 such innings. India didn't lose any wicket during the first ten on two occasions when they batted first. Pakistan, too, survived the first ten in the final without losing a wicket, whereas South Africa lost only one in the first Powerplay during the three games when they batted first.
The stats in the first ten were a contrast to the 2015 World Cup, when teams batting first managed only 28.70 runs per wicket, losing an average of 1.5 wickets per match, compared to 0.5 in the Champions Trophy this year. Despite losing far fewer wickets, teams still scored at a higher run rate in this year's Champions Trophy than in the 2015 World Cup.
7.18 The average run rate for teams batting first in the last ten overs in the Champions Trophy. This was significantly lower than the run rate of 9.32 achieved in the 2015 World Cup, when teams made full use of the rule that allowed only four fielders outside the circle in the last ten. With an extra fielder allowed outside the circle in this tournament, most teams struggled to tee off in the last ten. Among the eight teams, only India (run rate 11.61) and Pakistan (9.10) scored at more than seven an over in the last 10 overs when batting first.
134 Wickets for seamers in this tournament, at an average of 37.26 and an economy rate of 5.43. Spinners had a similar economy rate (5.47), but conceded 54.47 runs per wicket. They took only one wicket in 18 overs during the first Powerplay, at an economy rate of 5.38, while seamers took 30 wickets at an economy rate of 4.82.
| Bowler type | Wickets | Average | Econ rate | Strike rate |
| Pace | 134 | 37.26 | 5.43 | 41.1 |
| Spin | 36 | 54.47 | 5.47 | 59.7 |
S Rajesh is stats editor of ESPNcricinfo. @rajeshstats
Read in App
Elevate your reading experience on ESPNcricinfo App.