Foreign players leave huge impact
An analysis of team-wise batting and bowling performances in IPL 2012
The ESPNcricinfo performance analysis, which was primarily used to analyse individual batting and bowling performances in the IPL, can be extended to measure similar parameters for each team. As the tournament nears its business end, a team-wise performance analysis throws up some interesting results. Some teams have been relying heavily on the form of Indian players while some others have tasted success due to the exploits of overseas players. A detailed study of batting performances is an accurate indicator of the form of the top and middle-order batsmen in each team, and together with a similar analysis of bowling performances, it helps provide a better understanding of team composition.
The performance of the teams has been analysed in two different periods. The first phase involves all matches played between the start of the tournament and April 19. The second phase analyses all matches played from April 20 to May 6. At first glance, one can observe that nearly all teams have done much better on the batting front in the second period. In the first period, Rajasthan Royals were the only team who managed to start well with the bat. Ajinkya Rahane and Owais Shah were terrific at the start of the tournament and this is clearly reflected in the table. Royals' average points (11.77) in the first period, is well above the average for the tournament (8.12) and comfortably ahead of second-placed Delhi Daredevils (9.38). Batsmen in the Kolkata Knight Riders and Mumbai Indians teams struggled to compile high scores on slow pitches and hence have a much lower average score. Kings XI Punjab had mixed success in the beginning of the IPL and failed to post big scores. Their average in the period (5.90) is the lowest among all teams.
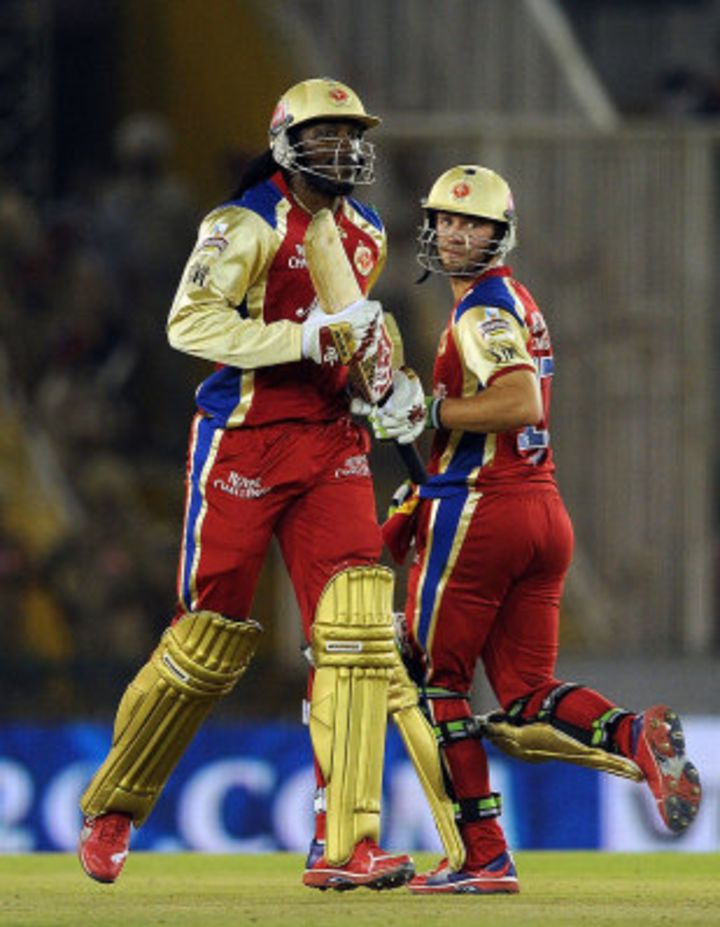
In the second phase of the IPL, when bat has almost always dominated the ball, four teams have an average score above ten with Royal Challengers Bangalore on top with 11.85 points. Royal Challengers boast an outstanding batting line-up with Chris Gayle and AB de Villiers in prime form and it is not surprising that they have the maximum number of innings in the list of top-50 performances. Mumbai Indians and Chennai Super Kings have not quite been able to repeat their run in previous years this time round and have an average score lower than the corresponding number for the tournament. While every top knock (top-50 performance) for Royal Challengers has been scored by a foreign player, the case is quite the opposite for Daredevils and Knight Riders for whom Virender Sehwag and Gautam Gambhir have been the most prolific.
All stats updated till the end of the matches on May 6, 2012
| Team | Avg points (Apr 4 - Apr 19) | Avg points (Apr 20 - May 6) | Overall avg points | Inns in top 50 (Indian player/foreign player) |
| Deccan Chargers | 8.10 | 9.79 | 9.03 | 1/5 |
| Delhi Daredevils | 9.38 | 11.61 | 10.58 | 5/2 |
| Kings XI Punjab | 5.90 | 8.94 | 7.45 | 0/3 |
| Kolkata Knight Riders | 7.05 | 10.48 | 8.21 | 5/0 |
| Mumbai Indians | 7.71 | 7.57 | 7.63 | 3/3 |
| Royal Challengers Bangalore | 7.20 | 11.85 | 9.18 | 0/9 |
| Rajasthan Royals | 11.77 | 10.72 | 11.31 | 3/3 |
| Chennai Super Kings | 9.06 | 8.57 | 8.84 | 0/3 |
| Pune Warriors | 7.70 | 9.88 | 8.70 | 2/3 |
| Overall | 8.12 | 9.73 | 8.88 | 19/31 |
On the bowling front, the points difference between the top-ranked team (Mumbai Indians) and the lowest-ranked team (Super Kings) in the first phase is nearly as much as the corresponding difference in the batting. All three teams with more than 20 points in the first phase have experienced a fall in the score in the second phase. While the average points (overall) in the second phase is lower than the corresponding number in the first, Kings XI and Super Kings have managed to improve on their score in the first phase. The contrast in performances (top-50 performances) of Indian and foreign players is not as vast as in the case of batting. Dale Steyn has been outstanding for Chargers while his South African fast-bowling partner Morne Morkel has had a similar influence for Daredevils. Lasith Malinga, the leading wicket-taker across the five seasons of the IPL, has been regularly ranked on top of the list of best bowlers in the ESPNcricinfo analysis. He, along with Kieron Pollard, has five performances in the top 50. Kings XI are the only team to have a significant number of top-50 performances by Indian players (6) including two each by Parvinder Awana and Piyush Chawla.
| Team | Avg points (Apr 4 - Apr 19) | Avg points (Apr 20 - May 6) |
Overall avg points | Avg points per match | Spells in top 50 (Indian bowlers/foreign bowlers) |
| Deccan Chargers | 17.88 | 16.38 | 16.94 | 103.37 | 1/3 |
| Delhi Daredevils | 20.69 | 17.42 | 19.08 | 108.79 | 3/2 |
| Kings XI Punjab | 18.57 | 18.75 | 18.67 | 105.25 | 6/4 |
| Kolkata Knight Riders | 17.17 | 18.53 | 17.73 | 108.16 | 2/4 |
| Mumbai Indians | 20.76 | 17.20 | 18.71 | 112.30 | 4/7 |
| Royal Challengers Bangalore | 17.31 | 16.98 | 17.14 | 101.17 | 2/2 |
| Rajasthan Royals | 20.20 | 17.24 | 18.87 | 106.37 | 2/1 |
| Chennai Super Kings | 14.82 | 15.56 | 15.16 | 99.25 | 1/2 |
| Pune Warriors | 18.61 | 16.09 | 17.35 | 104.11 | 2/2 |
| Overall | 18.32 | 17.07 | 17.69 | 105.40 | 23/27 |
The highlight of the batting analysis by position is the difference in performance of the two opening batsmen. While the strike batsman (No.1) has an average score of 10.26, the non-strike batsman (No.2) has a much higher average score (17.21). Given the form of Gayle and Sehwag, who both have five performances in the top-50, it is no surprise that the difference between the No.2 and No.1 batsmen is the highest for Royal Challengers and Daredevils. Kings XI and Pune Warriors have both struggled for consistency at the top of the order while Faf du Plessis has proved to be the saving grace for Super Kings. The overall average for the No.3 position is second only to that of the No.2 position. Cameron White, who has made three seventy-plus scores so far in the tournament, has been chiefly responsible for the high average at No.3 for Chargers. Kevin Pietersen's departure is likely to bring down Daredevils' average score for the No.3 position, In sharp contrast, Royal Challengers have the lowest average at the position because of Virat Kohli's run of poor scores. With Sehwag and Pietersen doing the bulk of the scoring, Daredevils' middle-order has hardly been tested and their average scores at No.4 and No.5 are among the lowest. Although Royals and Super Kings have strong middle-order performances, de Villiers' stunning knocks have ensured that Royal Challengers have the highest average score at No.5. Steven Smith's superb form has ensured that Warriors have a far higher average than all teams at the crucial No.6 position. Overall, the No.2 and No.3 positions have contributed the most scores to the list of top-50 performances (24 and 10 respectively).
| Team | 1 | 2 | 3 | 4 | 5 | 6 | 7 |
| Deccan Chargers | 7.19 | 19.58 | 22.15 | 12.32 | 5.91 | 4.33 | 0.13 |
| Delhi Daredevils | 6.70 | 26.70 | 21.37 | 3.14 | 3.82 | 2.35 | 8.27 |
| Kings XI Punjab | 11.49 | 6.70 | 14.82 | 12.17 | 5.00 | 4.77 | 4.77 |
| Kolkata Knight Riders | 12.78 | 19.31 | 10.60 | 8.04 | 1.99 | 4.04 | 6.19 |
| Mumbai Indians | 10.69 | 8.86 | 14.89 | 8.88 | 11.16 | 5.57 | 3.66 |
| Royal Challengers Bangalore | 10.05 | 25.97 | 6.96 | 5.29 | 17.25 | 4.74 | 1.14 |
| Rajasthan Royals | 16.51 | 20.63 | 12.74 | 10.92 | 13.15 | 4.06 | 1.86 |
| Chennai Super Kings | 11.57 | 14.48 | 12.22 | 10.52 | 11.85 | 2.88 | 8.54 |
| Pune Warriors | 5.41 | 14.92 | 8.75 | 14.73 | 6.50 | 16.38 | 6.33 |
| Overall avg | 10.26 | 17.21 | 13.86 | 9.71 | 8.76 | 5.60 | 4.60 |
| No of inns in top 50 | 5 | 24 | 10 | 5 | 5 | 0 | 1 |
Madhusudhan Ramakrishnan is a sub-editor (stats) at ESPNcricinfo
Read in App
Elevate your reading experience on ESPNcricinfo App.