Battle of the last ten overs
Both teams are in good form coming into this clash, but Sri Lanka will derive confidence from their superior record against New Zealand in recent global tournaments
New Zealand have left behind their dismal lead-up to the tournament when they failed to win a single match against Bangladesh and India. With convincing performances against the lower-ranked teams and an emphatic win over Pakistan, New Zealand have once again reiterated the fact that they perform much better than expected in bigger tournaments. Since the 1992 World Cup, they have made the semi-final on three occasions and the quarter-final once. However, New Zealand have not been very successful against Sri Lanka in global tournaments. They lost both their meetings in the 2007 tournament including the semi-final, when Mahela Jayawardene scored a superb 115. Despite five defeats in their last six meetings, New Zealand can take heart from their win in the most recent clash in the Champions Trophy in 2009.
While the overall head-to-head record between the two teams is fairly even, Sri Lanka have been the better side since the start of 2000. They have dominated New Zealand in matches played in neutral venues, winning six and losing three. Since 2007, Sri Lanka have won five matches and lost two. New Zealand will be happy to play their game outside Sri Lanka as they have a very poor record there: they have won just one game and lost six against Sri Lanka in ODIs played in Sri Lanka since the start of 2000.
| Played | Won | Lost | W/L ratio | |
| Overall | 72 | 32 | 35 | 0.91 |
| Since 2000 | 32 | 19 | 11 | 1.73 |
| Neutral venues since 2000 | 9 | 6 | 3 | 2.00 |
| Since 2007 | 9 | 5 | 2 | 2.50 |
| In World Cup | 7 | 4 | 3 | 1.33 |
| In Champions Trophy | 3 | 2 | 1 | 2.00 |
Sri Lanka have been the better side in home and away ODIs. While New Zealand have a slightly higher batting average in home matches, they have not done as well in away games. Their bowling has been slightly more economical than Sri Lanka's in away games. In matches played in India, Sri Lankan bowlers average a very high 54.67 per wicket, while New Zealand have performed better. Both teams, however, have very poor win-loss ratios in matches played in India.
| Team | Period | Matches | W/L ratio | Runs/wicket (batting) | Run rate | Runs/wicket(bowling) | Economy rate | Average diff | Run rate diff |
| Sri Lanka(home) | 2008-2011 | 35 | 1.46 | 32.38 | 5.13 | 26.00 | 4.84 | 6.38 | 0.29 |
| New Zealand(home) | 2008-2011 | 29 | 1.18 | 34.28 | 5.78 | 31.82 | 5.20 | 2.46 | 0.58 |
| Sri Lanka(away) | 2008-2011 | 49 | 1.42 | 31.71 | 5.19 | 28.95 | 4.98 | 2.76 | 0.21 |
| New Zealand(away) | 2008-2011 | 43 | 0.90 | 27.67 | 4.95 | 27.18 | 4.74 | 2.49 | 0.19 |
| Sri Lanka(in India) | 2007-2011 | 9 | 0.40 | 35.45 | 5.74 | 54.67 | 6.16 | -19.22 | -0.42 |
| New Zealand(in India) | 2007-2011 | 9 | 0.50 | 32.30 | 5.39 | 36.36 | 5.31 | -4.06 | 0.08 |
In matches since 2008, there is very little to choose between the two sides when the performances across various phases of an innings is compared. Sri Lanka have been the better batting team in the first ten overs with a higher average and run-rate. New Zealand, though, have been the slightly better bowling team in the same phase. The teams are very evenly matched in the middle overs with the same run-rate difference. A more powerful lower order has ensured that New Zealand have been the more dominant batting team in the end overs. In ODIs since 2008, New Zealand's run rate of 7.49 in the last ten overs is lower only than that of South Africa (7.76) and Pakistan (7.51).
| Team | Period(overs) | Batting average | Run rate | Bowling average | Economy rate | Run rate difference |
| Sri Lanka | 0-15 | 38.67 | 5.12 | 32.80 | 4.72 | 0.40 |
| New Zealand | 0-15 | 33.08 | 4.94 | 32.41 | 4.57 | 0.37 |
| Sri Lanka | 16-40 | 36.65 | 4.76 | 28.01 | 4.70 | 0.06 |
| New Zealand | 16-40 | 30.15 | 4.75 | 32.40 | 4.69 | 0.06 |
| Sri Lanka | 41-50 | 19.89 | 6.99 | 21.14 | 6.54 | 0.45 |
| New Zealand | 41-50 | 23.22 | 7.49 | 20.09 | 6.95 | 0.54 |
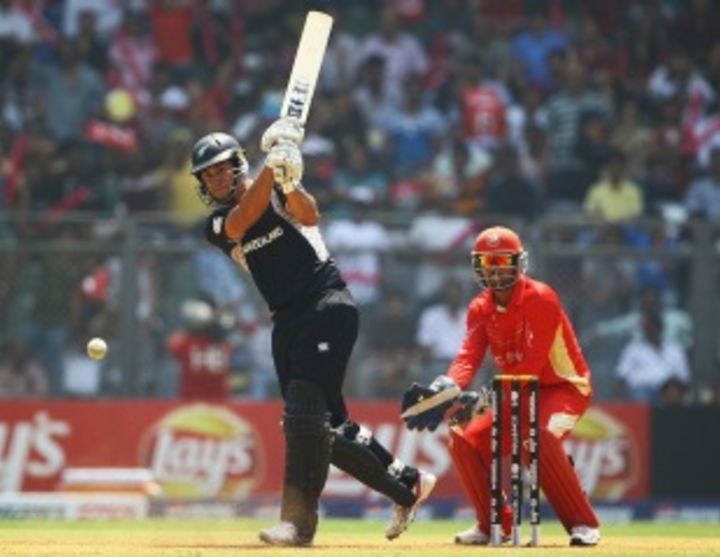
Ross Taylor's remarkable assault on the Pakistan bowlers in the last four overs and his subsequent 74 off 44 balls against Canada is a huge boost for New Zealand ahead of the bigger games. While Martin Guptill has been quite consistent, Brendon McCullum has also played himself into form at the top of the order with a century against Canada. The middle order, though, was not impressive against Australia and will be tested against a strong Sri Lankan bowling attack.
With Tillakaratne Dilshan and Upul Tharanga scoring centuries against Zimbabwe, the worries for Sri Lanka at the top of the order have eased. However, apart from the experience of Kumar Sangakkara and Mahela Jayawardene, there remains a doubt about the ability of the middle order to stand up and perform in the big matches.
While Sri Lanka's bowling is at full strength, New Zealand's attack is considerably weaker in the absence of the economical Daniel Vettori and the in-form Kyle Mills. Mills bowled superbly in the huge win over Pakistan and his loss could be crucial. The inexperience of New Zealand's bowling when compared to the variety in the Sri Lankan attack could prove to be a vital factor in a major match.
The ability of New Zealand's powerful middle order to accelerate in the end overs was demonstrated against Pakistan and Canada. From a score of 188 in 44 overs, they added 114 runs in the last six overs against Pakistan. Against Canada too, they scored more than 100 runs in the last ten overs. They will be up against a bowling attack which is the best when it comes to bowling in the final overs. Sri Lanka economy rate of 6.54 runs per over in the last ten overs of matches in the last three years is better than Australia's (6.70) and South Africa's (6.94). Taylor, Jacob Oram and Scott Styris score at more than nine runs per over and have a boundary percentage of over 60. They will face a strong test against Lasith Malinga and Muttiah Muralitharan, who have not only been economical but have also been among the wickets in the end overs. Muralitharan, in particular, has been stunning, conceding at just over five runs per over and conceding a boundary percentage of just over 32.
| Batsman | Runs | Strike rate | 4s | 6s | % boundary runs scored |
| Jacob Oram | 300 | 9.83 | 17 | 19 | 60.67 |
| Ross Taylor | 238 | 9.27 | 21 | 12 | 65.54 |
| Scott Styris | 220 | 9.16 | 23 | 9 | 66.36 |
| Nathan McCullum | 263 | 7.20 | 24 | 7 | 52.47 |
| Bowler | Wickets | Runs conceded | Economy rate | 4s | 6s | % boundary runs conceded |
| Muttiah Muralitharan | 13 | 319 | 5.06 | 20 | 4 | 32.60 |
| Ajantha Mendis | 21 | 395 | 5.75 | 25 | 6 | 34.43 |
| Angelo Mathews | 4 | 109 | 6.05 | 8 | 0 | 29.35 |
| Lasith Malinga | 21 | 427 | 6.67 | 32 | 4 | 35.59 |
The Wankhede stadium has hardly hosted many games in recent years. The last day-night game was played between India and Australia in 2007. On that occasion, India won a close low-scoring game by two wickets. Of the four day-night matches played in Mumbai since 2000, teams batting first have won two and lost two. The only match played in the tournament at this venue was a high-scoring day game with New Zealand piling up 358 and Canada replying with 261.
Read in App
Elevate your reading experience on ESPNcricinfo App.