A bowling paradise where Amla and de Villiers thrive
South Africa presents the most challenging conditions for batsmen, but you wouldn't know that from the recent home form of their top two batsmen
Tough for batsmen
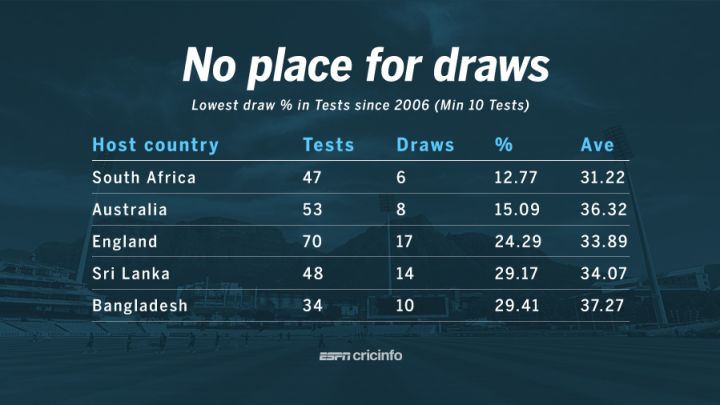
Pitches in many parts of the world are becoming more batting-friendly, but South Africa remains a country where, by and large, pitches still consistently offer assistance to fast bowlers. There is swing, seam and bounce on offer, which makes South Africa the most challenging country to score runs in in Test cricket over the last several years.
Since the beginning of 2006, only six out of 47 Tests have been drawn: the draw percentage of 12.77 is the smallest among all countries that have hosted at least ten Tests during this period. The average of 31.22 runs per wicket is also the least among all countries.
Kingsmead, which is the venue for the Boxing Day Test, has produced a decisive result in each of the eights Tests since 2006, with South Africa winning only three and losing five.
Centurion and Johannesburg have had only one draw each, out of 19 Tests they have hosted in ten years. (Click here for ground-wise results list in South Africa since January 2006.)
All that pace, swing and movement has generally made life difficult for opening batsmen in South Africa: their overall average partnership of 31.41 in the last ten years is the lowest among all countries that have hosted at least ten Tests. South Africa's openers have themselves struggled in home conditions, averaging 31.14 per partnership, compared to 31.64 by the overseas teams; seven of the 11 century partnerships in South Africa during this period have been by overseas teams.
The four South African openers who have played 12 or more innings at the top of the order during this period all have sub-40 batting averages: Graeme Smith (37.22 in 72 innings), Alviro Petersen (34.29 in 26 innings), AB de Villiers (17.46 in 15 innings) and Herschelle Gibbs (16.66 in 12 innings). Alastair Cook has done reasonably well here, though, scoring 287 runs in seven innings at an average of 41.
| Host Country | P'ships | Ave stand | 100 p'ships |
| South Africa | 173 | 31.41 | 11 |
| Sri Lanka | 179 | 32.96 | 9 |
| New Zealand | 142 | 34.97 | 8 |
| West Indies | 156 | 36.10 | 12 |
| England | 257 | 37.86 | 19 |
| U.A.E. | 82 | 40.27 | 11 |
| Australia | 200 | 40.72 | 19 |
| Bangladesh | 125 | 42.84 | 12 |
| India | 160 | 46.92 | 19 |
No longer struggling at home
While conditions in South Africa have generally been difficult for batting, their two best batsmen have come to terms with them and have been outstanding in home Tests over the last few years. Overall, both have a lower average at home than away: Amla averages 48.71 at home, and 52.64 in away and neutral venues, while de Villiers averages 47.98 in home Tests, and 55.23 in away and neutral venues. However, the overall numbers for both batsmen are deceptive, for both have picked up their home stats in the last few seasons.
Since the beginning of 2010, Amla has averaged 58 in home Tests, up from 40 in the period before that. In seven out of nine series since 2010, his average has exceeded 50; in nine home series before 2010, only three times did his average go beyond 50. In two home series against Australia in the last five years, he has averaged 59.75 and 51.60, which is a fair indication of how far his batting has come along.
With de Villiers, the contrast between his recent years and the earlier period is even more stark: before 2009, his home average in 26 Tests was a mediocre 30.34; in five out of nine series during this period, his average was less than 30. Since the start of 2009, though, his home average has more than doubled, to 66.07, with seven where he averaged more than 50, out of ten. He has scored ten hundreds in his last 28 home Tests, compared with just two in his first 26.
De Villiers' home average of 66.07 since the beginning of 2009 is higher than his away average of 54.92, while Amla's away numbers are still better than his home stats since 2010, but only marginally. Since the beginning of 2010, de Villiers and Amla are comfortably the two top run scorers in Tests in South Africa.
| Period | Tests | Runs | Average | 100s |
| Till Dec 2009 | 22 | 1444 | 40.11 | 5 |
| Jan 2010 onwards | 23 | 1917 | 58.09 | 6 |
| Overall at home | 45 | 3361 | 48.71 | 11 |
| Period | Tests | Runs | Average | 100s |
| Till Dec 2008 | 26 | 1244 | 30.34 | 2 |
| Jan 2009 onwards | 28 | 2643 | 66.07 | 10 |
| Overall at home | 54 | 3887 | 47.98 | 12 |
| Home/ away | Tests | Runs | Average | 100s |
| Home | 23 | 1917 | 58.09 | 6 |
| Away | 26 | 2384 | 62.73 | 10 |
| Home/ away | Tests | Runs | Average | 100s |
| Home | 28 | 2643 | 66.07 | 10 |
| Away | 26 | 2087 | 54.92 | 4 |
Head-to-head battles to watch out for
South Africa's top two batsmen and England's top two bowlers have played three Test series against each other, which means there is a fair amount of head-to-head data among them. Amla is in the throes of a batting slump at the moment, but he can take some comfort from his stats against England's two leading bowlers, James Anderson and Stuart Broad.
Against Broad, Amla averages 75.33, while his average against Anderson is a whopping 127; the last time the two played each other - in England in 2012 - Amla took 109 runs from 164 balls off Anderson, without being dismissed once. In that series Broad didn't dismiss him either, conceding 86 from 155 balls. Amla was in sublime form in that series, though, scoring 482 runs at 120.50, which is a far cry from the form he has displayed recently.
De Villiers has been superb against Anderson as well, but he has struggled against Broad, being dismissed seven times at an average of 20. In the series in South Africa in 2009-10, Broad dismissed de Villiers four times conceding 58 runs, while in 2012 in England he had figures of 2 for 26 against de Villiers. If Broad comes anywhere close to replicating those figures this time around, England should be well on their way to having a good series.
Among England's current squad, Cook is the one batsman who has had plenty of batting against South Africa's current top bowlers. His overall numbers are pretty impressive against Dale Steyn, but not so good against Morne Morkel and Vernon Philander. The last time England toured South Africa, Morkel had figures of 4 for 60 against Cook, while Philander dismissed him three times conceding 45 in England in 2012. Given these stats, Cook will surely not mind the fact that Philander has been ruled out of the first two Tests of the series.
| Batsman | Runs | Balls | Dismissals | Average |
| Hashim Amla | 254 | 429 | 2 | 127.00 |
| AB de Villiers | 193 | 393 | 2 | 96.50 |
| Batsman | Runs | Balls | Dismissals | Average |
| Hashim Amla | 226 | 437 | 3 | 75.33 |
| AB de Villiers | 140 | 282 | 7 | 20.00 |
| Bowler | Runs | Balls | Dismissals | Average |
| Dale Steyn | 147 | 329 | 3 | 49.00 |
| Morne Morkel | 175 | 428 | 6 | 29.16 |
| Vernon Philander | 45 | 104 | 3 | 15.00 |
S Rajesh is stats editor of ESPNcricinfo. Follow him on Twitter
Read in App
Elevate your reading experience on ESPNcricinfo App.