All-round India clear favourites for World T20
The hosts' superb recent form in T20Is has been due to consistency and the presence of several match-winners with both bat and ball
The Indian team has been on a roll in T20Is in 2016: in ten matches, they have won nine and lost one. That one defeat was on a seaming deck against a young Sri Lankan pace attack, but either side of that defeat they have notched up some impressive results, winning three on the trot in Australia, taking revenge for that lone loss in Pune, and then going undefeated in the Asia Cup league games. In a format whose vagaries present a huge challenge to teams seeking consistent wins, the results that India have produced makes then firm favourites for the World T20, especially given that they are playing on home turf.
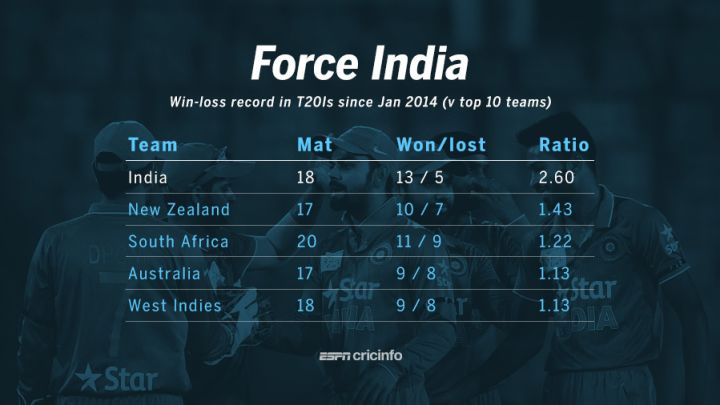
Since the beginning of 2014, India's win-loss record versus the top ten teams in T20Is is 13-5, which is by far the best - no other team has won as many, or lost as few matches as India have. The next best are New Zealand with a 10-7 record, while South Africa, Australia, and West Indies have all won a game or two more than they have lost.
India's numbers have been solid with both bat and ball in the last couple of years. Their run rate hasn't been the highest - in fact, five of the nine teams in the table below have done better - but India's bowling stats have been exceptional. Their average and economy rate are the best among all teams. They have been the only team with a sub-20 bowling average and an economy rate of less than 7.50.
| Team | Mat | Won/ lost | Ratio | Bat ave | Run rate | Bowl ave | Econ rate |
| India | 18 | 13/ 5 | 2.60 | 31.54 | 7.86 | 19.25 | 7.05 |
| New Zealand | 17 | 10/ 7 | 1.43 | 23.96 | 8.28 | 20.65 | 7.71 |
| South Africa | 20 | 11/ 9 | 1.22 | 32.34 | 8.27 | 21.07 | 8.17 |
| Australia | 17 | 9/ 8 | 1.13 | 24.20 | 8.49 | 26.79 | 7.96 |
| West Indies | 18 | 9/ 8 | 1.13 | 24.54 | 8.08 | 24.13 | 8.00 |
| Sri Lanka | 19 | 9/ 10 | 0.90 | 20.51 | 7.53 | 23.71 | 7.93 |
| England | 18 | 7/ 10 | 0.70 | 22.53 | 8.34 | 29.09 | 8.81 |
| Pakistan | 18 | 6/ 11 | 0.55 | 19.01 | 7.35 | 24.75 | 7.83 |
| Bangladesh | 14 | 4/ 9 | 0.44 | 19.10 | 6.81 | 25.33 | 7.50 |
With the bat, India have benefited from having two of the best in the format in their top three. Virat Kohli has been sensational, scoring 740 runs at an average of 82.22 and a strike rate of almost 135, while Rohit Sharma is the only other batsman to score 600-plus runs against the top ten teams in T20Is during this period. They are the two leading run scorers during this period, and their presence has given India's top three an irresistible combination of flair and solidity.
Thanks largely to those two, India have had 16 fifty-plus scores in 18 matches, and 26 scores of 30 or more. Kohli and Rohit have contributed 15 of the 16 fifty-plus scores, with the only other one coming from Shikhar Dhawan. Dhawan has been fairly ordinary during this period, averaging 20 at a strike rate of 118, but Kohli and Rohit have more than compensated for his failures.
While India have averaged almost one 50-plus score per game during this period, other teams have struggled to get one in two games. South Africa have ten from 20 games, Australia have nine from 17, West Indies nine from 18, Sri Lanka six from 19, and Pakistan three from 18. In terms of 30-plus scores, India have 26 from 18, again the most by any team. The prolific form of Kohli and Rohit also means India's top three have the highest average among all teams; it's often argued that average isn't a relevant stat in 20-over cricket, but for top-order batsmen it indicates solidity and consistency at the top of the order, and for India the high average means they usually have wickets in hand to make good use of the slog overs.
| Team | Mat | Runs | Average | SR | 30+ scores |
| India | 18 | 1738 | 38.62 | 127.98 | 26 |
| New Zealand | 17 | 1500 | 34.88 | 140.97 | 24 |
| South Africa | 20 | 1801 | 33.98 | 136.64 | 24 |
| Australia | 17 | 1449 | 31.50 | 137.86 | 20 |
| West Indies | 18 | 1372 | 27.44 | 125.52 | 20 |
| Zimbabwe | 17 | 1236 | 25.22 | 122.25 | 17 |
| Bangladesh | 14 | 838 | 23.27 | 111.58 | 11 |
| England | 18 | 1194 | 22.96 | 128.52 | 16 |
| Sri Lanka | 19 | 1138 | 19.96 | 117.92 | 16 |
| Pakistan | 18 | 824 | 15.84 | 100.24 | 7 |
In the Powerplay overs, there are five teams that score quicker than India, but many of them tend to lose wickets in the middle overs. Australia have consistently impressive numbers through all stages, with an especially high scoring rate in the last five, while New Zealand's firepower is in evidence too. The numbers are fairly closely packed together, though Pakistan's poor stats in the Powerplays stand out.
| Batting Team | First 6: Ave | RR | 6.1-15.0: Ave | RR | Last 5: Ave | RR |
| Australia | 33.76 | 8.27 | 29.75 | 8.64 | 17.33 | 10.23 |
| Bangladesh | 20.15 | 6.33 | 21.82 | 6.50 | 16.77 | 9.13 |
| England | 24.14 | 7.60 | 27.00 | 7.83 | 22.74 | 9.51 |
| India | 34.86 | 7.42 | 37.68 | 7.49 | 15.97 | 9.52 |
| New Zealand | 44.05 | 8.69 | 24.63 | 7.79 | 19.26 | 9.89 |
| Pakistan | 17.67 | 6.05 | 22.78 | 7.17 | 22.43 | 9.36 |
| South Africa | 40.41 | 8.08 | 36.18 | 7.80 | 12.89 | 8.72 |
| Sri Lanka | 20.02 | 7.02 | 24.57 | 7.04 | 11.92 | 8.52 |
| West Indies | 41.05 | 8.04 | 21.96 | 7.23 | 14.96 | 8.24 |
Perhaps the bigger surprise than India's batting has been the manner in which their bowlers have performed over the last couple of years. Their overall economy rate of 7.05 is the best, and while the spinners have led the way with 66 wickets at a superb average and economy rate, the quicker bowlers haven't done badly either. Ashish Nehra has completely justified the selectors' faith in him, taking 12 wickets against the top ten teams in nine games at 18.83 and an economy rate of 7.29, while Jasprit Bumrah has been a revelation, taking 13 wickets at 15.92 and an economy rate of 6.36.
The leader of the pack, though, has clearly been R Ashwin, with 31 wickets 13.12 and an economy rate of 5.88. With Ravindra Jadeja chipping in with 16 wickets as well, India have had most bases covered with the ball.
| Team | Pace-Wkts | Ave | Econ rate | Spin-Wkts | Ave | Econ rate |
| India | 46 | 22.47 | 7.23 | 66 | 19.60 | 6.55 |
| Zimbabwe | 39 | 35.48 | 9.07 | 45 | 26.00 | 7.64 |
| South Africa | 90 | 23.73 | 8.33 | 41 | 19.92 | 7.42 |
| Pakistan | 57 | 26.92 | 8.20 | 40 | 27.05 | 7.02 |
| West Indies | 64 | 28.76 | 8.94 | 38 | 21.15 | 6.24 |
| Bangladesh | 35 | 28.94 | 7.85 | 34 | 24.61 | 6.74 |
| Sri Lanka | 70 | 24.70 | 8.00 | 32 | 31.37 | 7.51 |
| Australia | 62 | 29.66 | 7.92 | 27 | 24.55 | 7.28 |
| New Zealand | 88 | 21.23 | 7.64 | 27 | 23.22 | 7.37 |
| England | 70 | 30.14 | 9.04 | 21 | 35.80 | 7.76 |
Breaking it up into the three stages of a 20-over innings, the Indian bowlers have consistently come up with excellent numbers at every stage, leading the economy charts in the first six and middle overs, and coming next only to South Africa in the last five. They have also been among the wickets in the middle overs, taking 43 at 24.30. Only South Africa have a better average in the middle overs.
With such complete numbers, it isn't surprising that India have racked up the sort of results they have recently in 20-over cricket. The format is one that's is most favourable for upsets, but even so, India's recent record - and the venue for the tournament - makes them clear favourites for the World T20.
| Bowling Team | First 6: wkts | Ave | Econ | 6.1-15.0: wkts | Ave | Econ | Last 5: wkts | Ave | Econ |
| Australia | 29 | 25.41 | 7.22 | 31 | 35.70 | 7.63 | 29 | 22.68 | 8.65 |
| Bangladesh | 16 | 31.43 | 6.44 | 30 | 27.66 | 7.09 | 23 | 22.47 | 8.88 |
| England | 22 | 40.22 | 8.24 | 39 | 31.58 | 8.07 | 30 | 24.83 | 10.61 |
| India | 32 | 21.46 | 6.36 | 43 | 24.30 | 6.45 | 38 | 16.84 | 8.64 |
| New Zealand | 30 | 22.93 | 6.74 | 46 | 24.39 | 7.33 | 39 | 17.58 | 9.22 |
| Pakistan | 30 | 24.73 | 6.87 | 38 | 30.34 | 7.16 | 29 | 24.89 | 10.00 |
| South Africa | 22 | 48.22 | 8.84 | 56 | 22.91 | 7.57 | 53 | 11.49 | 7.92 |
| Sri Lanka | 28 | 30.28 | 7.43 | 39 | 31.07 | 7.40 | 35 | 19.22 | 9.34 |
| West Indies | 29 | 27.44 | 7.46 | 38 | 30.78 | 7.64 | 35 | 19.40 | 9.07 |
S Rajesh is stats editor of ESPNcricinfo. Follow him on Twitter
Read in App
Elevate your reading experience on ESPNcricinfo App.