Are England's top three too slow for ODIs?
Alastair Cook, Ian Bell or Jonathan Trott are not out-and-out aggressive batsmen, but they haven't done too badly in ODIs in the last 18 months
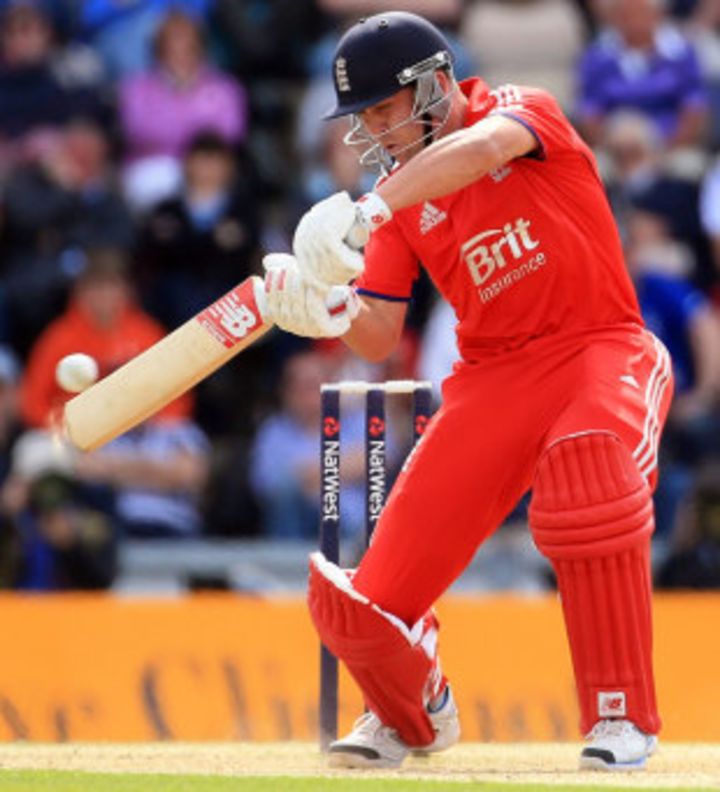
England have been one of the form teams of the Champions Trophy and are in the final, but much talk about the team has revolved around the somewhat anachronistic scoring rate of their top three. Alastair Cook, Ian Bell and Jonathan Trott tend to bat in a similar tempo, preferring a strike rate of around 75. They are also not given to flashy strokeplay, preferring to accumulate their runs steadily. In today's age of ODI cricket, when batsmen are expected to take advantage of the fielding restrictions, the scoring pattern and rate of England's top order has often come in for some flak. Here's a look at some of the numbers for England's top three, and a comparison with other teams over the last year and a half.
The table below shows the year-by-year stats for England's top three batsmen in ODIs over the last ten years, and it's clear that except for a couple of years in 2010 and 2011, the strike rates for their top three have always been in the mid-70s. In those two years, it wasn't Kevin Pietersen who made the difference, but Cook, Andrew Strauss and Craig Kieswetter, all of whom scored more than 750 runs at 90-plus strike rates. In all the years before that, and in the period since, the rate has hovered in the 70s.
What has changed, though, is the average of the top three. In the last 18 months, England's top order has averaged more than 47, which is much higher than they managed in the period before 2010, when the average was in the late 20s or early 30s.
A comparison with the other top teams makes for interesting reading as well. The period between 2007 and 2009 was when England's top order was scoring at a much slower rate than everyone else - the average strike rate for other sides was more than 80, while England plodded in the mid-70s. In the last 18 months, though, the strike rates of other top sides aren't much higher than England's, while their batting averages are a lot lower. This suggests England's top order has been giving the side far more solid starts, while scoring at roughly the same rate, over the last 18 months.
It needs to be clarified, though, that all these are overall numbers, and they don't suggest that there may not have been individual instances when the top three might have batted too slowly in the context of that match. Overall, though, England's top-order numbers look pretty good.
| England | Other top teams | |||||||
| Year | Inngs | Average | Strike rate | 100s/ 50s | Inngs | Average | Strike rate | 100s/ 50s |
| 2013 | 45 | 47.26 | 79.98 | 2/ 14 | 247 | 34.16 | 79.02 | 20/ 34 |
| 2012 | 44 | 50.71 | 76.52 | 6/ 10 | 402 | 34.88 | 79.20 | 26/ 75 |
| 2011 | 89 | 39.38 | 88.11 | 4/ 24 | 521 | 36.88 | 79.86 | 30/ 110 |
| 2010 | 51 | 41.02 | 88.86 | 4/ 14 | 434 | 36.56 | 83.39 | 27/ 89 |
| 2009 | 66 | 29.60 | 74.30 | 1/ 10 | 526 | 36.92 | 84.60 | 32/ 109 |
| 2008 | 58 | 33.00 | 77.66 | 2/ 9 | 436 | 37.57 | 84.25 | 32/ 92 |
| 2007 | 102 | 27.42 | 70.46 | 3/ 12 | 598 | 37.34 | 81.00 | 31/ 136 |
| 2006 | 60 | 31.87 | 75.56 | 2/ 12 | 558 | 36.18 | 78.34 | 40/ 113 |
| 2005 | 65 | 31.71 | 75.58 | 3/ 8 | 460 | 33.22 | 79.31 | 30/ 73 |
| 2004 | 60 | 34.98 | 74.13 | 3/ 16 | 530 | 34.89 | 75.78 | 25/ 100 |
The strategy that teams chalk up for the approach of their top order also depends on the firepower down the order. In the current set-up, England have Joe Root, Eoin Morgan, Jos Buttler and Ravi Bopara, all of whom are capable of forcing the pace later in the innings. England are clearly comfortable with having a top order whose main brief is to provide a solid foundation for others to capitalise on later. It's a strategy that has served them reasonably well, given that they have a win-loss ratio of 2.22 (20 wins, nine losses), better than any other team during this period.
Among all teams, India's top three have had the best strike rate, which isn't a surprise given that they have enforcers at the top of the order, and that they also play their home games in conditions that are often very good for batting. South Africa, New Zealand and Sri Lanka are the others with strike rates higher than England's, but the difference isn't that much. England's average, on the other hand, is much higher than that of the others.
| Team | Innings | Average | Strike rate | 100s/ 50s |
| India | 81 | 38.96 | 85.10 | 9/ 14 |
| South Africa | 75 | 37.31 | 82.56 | 5/ 15 |
| New Zealand | 78 | 33.80 | 81.51 | 4/ 15 |
| Sri Lanka | 127 | 40.18 | 81.51 | 11/ 24 |
| England | 89 | 48.92 | 78.22 | 8/ 24 |
| West Indies | 84 | 31.43 | 77.52 | 6/ 10 |
| Australia | 111 | 30.01 | 75.09 | 6/ 16 |
| Pakistan | 93 | 30.67 | 71.23 | 5/ 15 |
| Bangladesh | 42 | 27.70 | 70.51 | 2/ 7 |
| Zimbabwe | 27 | 23.76 | 69.05 | 1/ 3 |
The other point that's sometimes mentioned with respect to England's top order is their high dot-ball ratio in the early part of an innings. However, as the table below shows, there are other sides who have done worse than them in the first 15 overs of ODIs in the last 18 months. South Africa and India are on top again, with percentages of around 60, but England 64.47% isn't that much adrift of the top sides.
Where England are clearly superior to the other sides is in losing fewer wickets in the early overs. Most teams lose, on average, about two wickets in the first 15; England, on the other hand, have lost only 37 in 30 - 1.23 per game. Some might argue that England's slower run rate - which extends over more overs since these batsmen bat longer periods - puts more pressure on those following the top three than it might if they got out earlier, but the overall results show that this method has suited them quite well.
| Team | Innings | Wickets | Average | Run rate | Dot-ball % |
| South Africa | 25 | 43 | 40.93 | 4.69 | 59.78 |
| India | 27 | 56 | 35.82 | 4.95 | 60.49 |
| Sri Lanka | 43 | 81 | 36.64 | 4.76 | 62.31 |
| England | 30 | 37 | 54.56 | 4.58 | 64.47 |
| Australia | 37 | 77 | 30.74 | 4.30 | 65.02 |
| New Zealand | 26 | 56 | 29.32 | 4.21 | 67.69 |
| Pakistan | 31 | 58 | 30.63 | 3.89 | 68.41 |
| West Indies | 28 | 62 | 29.24 | 4.31 | 68.41 |
In the last 18 months, Cook, Bell and Trott have done the bulk of the batting in the top three for England, and are the only ones to have scored more than 500 runs at those positions. All three have fine averages, and have innings-to-fifties ratios of less than three, which shows their consistency. The dot-ball percentages for Cook and Bell are around 57, and while that's on the higher side, it isn't unacceptable for openers, who bat when there are more fielders in the circle, and hence tend to play out more dots.
| Batsman | Innings | Runs | Average | Strike rate | 100s/ 50s | Dot-ball% | 4s/ 6s |
| Alastair Cook | 30 | 1221 | 42.10 | 78.01 | 3/ 8 | 57.51 | 142/ 6 |
| Ian Bell | 26 | 1181 | 49.20 | 79.42 | 2/ 8 | 57.63 | 126/ 11 |
| Jonathan Trott | 22 | 973 | 57.23 | 74.38 | 1/ 7 | 50.92 | 71/ 1 |
| Kevin Pietersen | 9 | 466 | 58.25 | 85.19 | 2/ 1 | 53.02 | 48/ 6 |
Even among those three England batsmen, the flak for slow scoring has been directed more at Trott than at the other two. Justified or unfair? The table below lists the batsmen with the slowest strike rates in ODIs since the beginning of 2011, the period around which Trott became a regular in England's ODI side. In this period, Trott's strike rate of 77.53 is better than four batsmen (with a cut-off of 1500 runs). Among them is Kumar Sangakkara (strike rate 77.15), Mohammad Hafeez (75.66), Upul Tharanga (75.40), and Misbah-ul-Haq (69.95). Trott's average of 54.47, though, is third among the 17 batsmen who have scored 1500-plus runs during this period - only MS Dhoni and AB de Villiers have higher averages. It's true that Trott's average in losses (53.77) is almost as high as his average in wins (54.82), a stat that is brought forth to illustrate that his runs are often detrimental to the team cause. That seems to be an unfair rap, though, given that no other England batsman has averaged 40 in the ODIs that England have lost with Trott in the line-up.
On Sunday the focus will again be on England's top three, including Trott, as they take on India in the Champions Trophy final. Chances are that if they all contribute their average scores at a strike rate of around 80, England will be well served.
| Batsman | Innings | Runs | Average | Strike rate | 100s/ 50s |
| Misbah-ul-Haq | 57 | 2005 | 48.90 | 69.95 | 0/ 16 |
| Upul Tharanga | 50 | 1591 | 34.58 | 75.40 | 4/ 10 |
| Mohammad Hafeez | 63 | 1946 | 32.98 | 75.66 | 5/ 9 |
| Kumar Sangakkara | 60 | 2644 | 48.96 | 77.15 | 5/ 17 |
| Jonathan Trott | 50 | 2288 | 54.47 | 77.53 | 3/ 17 |
| Ian Bell | 50 | 1793 | 38.14 | 78.88 | 2/ 11 |
| Michael Clarke | 41 | 1653 | 47.22 | 79.50 | 2/ 11 |
S Rajesh is stats editor of ESPNcricinfo. Follow him on Twitter
Read in App
Elevate your reading experience on ESPNcricinfo App.