Australia's gaping hole at No. 3
Over the last three years, Australia's No. 3 batsmen have averaged 27.13 in Tests, which is worse than all teams except New Zealand and Zimbabwe
During the days of Ricky Ponting in his pomp, the fall of the first Australian wicket would be a moment of high alert for the opposition team, for the next man walking in would be the best of the Australian line-up, and arguably the best of any line-up during that period. More often than not, the one-hour passage of play immediately after his arrival would be one in which Australia would regain control after an early wicket, or consolidate the gains of a productive first-wicket partnership.
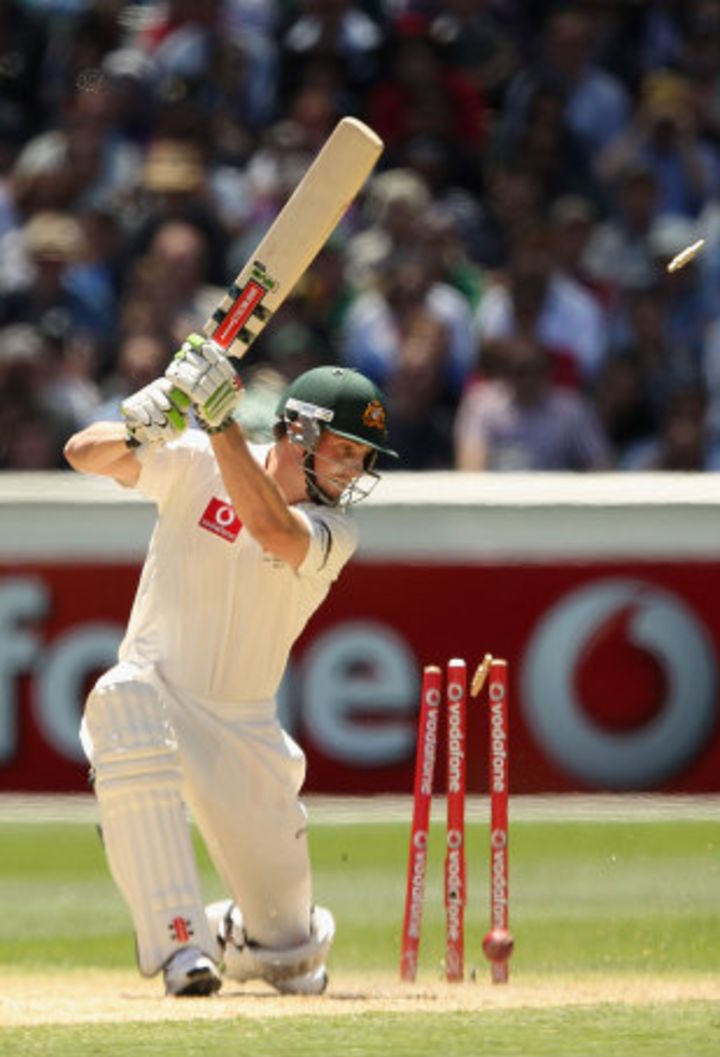
Fast forward to the present, and the fall of the first Australian wicket is now a signal for the No. 4 batsman to be on guard, for the second wicket usually follows the first pretty quickly. Phil Hughes' recent struggles in India - 25 runs in four innings, three of them at No. 3 - only brings further attention to a batting position that used to be an undoubted strength for Australia not so long ago but is now their biggest liability in their top-order batting line-up.
Over the last three years, beginning March 2010, Australia's No. 3 has been among the weakest of all sides in Test cricket - even Bangladesh have done significantly better at that position during this period, a stat which won't please a country that has historically produced some of the best batsmen who've ever batted at that position in Test cricket: over the history of Test cricket, West Indies and Australia are the only two sides whose collective No. 3 batting average is more than 45.
In these three years, though, that average has slipped alarmingly to 27.13 over 60 Test innings, which is lower than all other teams except New Zealand and Zimbabwe. Bangladesh have done 20% better, averaging 32.59. Australia's average second-wicket partnership during this period is 26.67, worse than all other teams except Zimbabwe.
Australia's problems at this position began when Ponting was still around. Between March 2010 and November 2011, he batted 22 times at that slot and averaged a mere 26.28, with a highest of 77. It wasn't good enough by any standards, let alone his own lofty ones, and the logical step was for him to make way for a player who initially looked tailor-made for that position. Shaun Marsh scored plenty from that position in Sri Lanka, but then suffered a severe case of the batting yips in the home series against India, making a pedestrian attack look ultra-threatening, as he gathered 17 runs from six completed innings. (His average of 2.83 remains the lowest in a series for an Australian top-four batsman who's played at least four innings.)
Since Marsh's debacle, Shane Watson and Phil Hughes have done the bulk of the batting at No. 3, without doing justice to the slot. A couple of stats indicate further how steep the fall has been: in 60 innings at this position, there has been only one century - Marsh's 141 against Sri Lanka in Pallekele. On the other hand, there have been ten ducks in these 60 innings, with Ponting and Marsh each contributing three. Twenty-two times the No. 3 batsman has got out for a single-digit score, and a further 15 times for less than 25. All these failures have put additional pressure on the rest of the Australian batsmen, and offered early encouragement to the opposition bowlers, in contrast to how it was during Ponting's pomp, when opposition bowlers were usually deflated early in the innings, and the rest of the Australian batting order benefited.
| Team | Players | Tests | Runs | Average | Strike rate | 100s/ 50s | Ducks |
| Sri Lanka | 5 | 28 | 2659 | 59.08 | 49.71 | 9/ 11 | 5 |
| South Africa | 4 | 27 | 2523 | 58.67 | 59.51 | 9/ 11 | 2 |
| England | 5 | 35 | 2844 | 53.66 | 50.94 | 8/ 12 | 2 |
| India | 4 | 33 | 2649 | 49.05 | 45.45 | 9/ 8 | 0 |
| Pakistan | 5 | 27 | 1967 | 40.97 | 40.02 | 4/ 13 | 5 |
| West Indies | 8 | 26 | 1606 | 37.34 | 44.58 | 3/ 11 | 3 |
| Bangladesh | 2 | 11 | 717 | 32.59 | 48.18 | 1/ 5 | 2 |
| Australia | 7 | 33 | 1574 | 27.13 | 46.66 | 1/ 11 | 10 |
| New Zealand | 11 | 22 | 1078 | 26.29 | 41.94 | 1/ 7 | 4 |
| Zimbabwe | 2 | 4 | 193 | 24.12 | 36.21 | 1/ 0 | 0 |
| Batsman | Tests | Runs | Average | 100s/ 50s | Ducks |
| Ricky Ponting | 12 | 552 | 26.28 | 0/ 5 | 3 |
| Shaun Marsh | 7 | 301 | 30.10 | 1/ 1 | 3 |
| Phil Hughes | 5 | 258 | 32.25 | 0/ 2 | 1 |
| Shane Watson | 4 | 228 | 28.50 | 0/ 2 | 1 |
| Usman Khawaja | 4 | 203 | 29.00 | 0/ 1 | 0 |
The fall in standards over the last three years becomes even starker when compared with the numbers for the two previous three-year periods. In the period between March 2007 and February 2010, Australia's No. 3 batsmen averaged 45.70, which was the third-best in the world, after Sri Lanka (64.23, aided by the ever-consistent Kumar Sangakkara) and South Africa (58.13, thanks largely to Hashim Amla). During that period Ponting wasn't at his best, but his stats were still very acceptable - six centuries in 56 innings at No. 3, and an average of 46.09.
In the previous three-year period, from March 2004 to February 2007, Australia's No. 3 stats were far and away the best of the lot - they averaged 68.23, with the next-best being Sri Lanka's 55.66. Of the 72 innings for the team at one-drop, Ponting played the role 60 times, scored 13 hundreds, and averaged 68.16. The team that struggled during that period was South Africa, who averaged 34.11 - Amla hadn't yet made his mark, and the others who occupied that slot had limited success.
Combining the stats over the entire six-year period from March 2004 to February 2010, Australia's No. 3 batsmen scored 21 hundreds in 129 innings, and averaged 57.46, next only to Sri Lanka's 59.37. Nineteen of those 21 hundreds belonged to Ponting. The other noteworthy stat is that there were only seven ducks in those 129 innings, compared to ten in 60 innings since March 2010.
In fact, working backwards from February 2010, ten ducks by Australia's No. 3 batsmen spanned 12 years, and 221 Test innings. The current lot has achieved the mark in only 60 innings.
| Team | 2007-2010* - Tests | Average | 100s/50s/0s | 2004-2007^ - Tests | Average | 100s/50s/0s |
| Sri Lanka | 25 | 64.23 | 8/11/1 | 31 | 55.66 | 8/11/2 |
| South Africa | 30 | 58.13 | 8/13/3 | 35 | 34.11 | 3/14/7 |
| Australia | 32 | 45.70 | 6/15/4 | 39 | 68.23 | 15/15/3 |
| India | 34 | 44.69 | 7/13/2 | 32 | 50.68 | 6/13/4 |
| Pakistan | 16 | 44.24 | 3/5/3 | 31 | 49.34 | 7/9/5 |
| West Indies | 26 | 40.32 | 6/6/2 | 31 | 46.34 | 8/6/8 |
| England | 38 | 31.92 | 6/5/4 | 41 | 40.39 | 5/19/5 |
| New Zealand | 25 | 29.88 | 0/10/5 | 25 | 48.64 | 5/7/4 |
| Bangladesh | 20 | 21.43 | 0/5/3 | 16 | 30.31 | 1/7/0 |
| Zimbabwe | - | - | - | 10 | 9.95 | 0/1/3 |
^ refers to the period between March 2004 and Feb 2007
Australia's No. 3 is their weakest batting position in the last three years (though the No. 4 batsmen haven't done a whole lot better). Their overall top seven average of 38.96 owes much to Michael Clarke, who has been by far the best of the lot, averaging 57.10 when none of the others, barring Michael Hussey, have played a significant number of matches and averaged over 45. That Australia have had more Test centuries from their No. 7 batsmen than their No. 3s in the last three years is another unusual stat, and one that says much about the failures at one-down. Over the last three years, Australia's Nos. 3 and 4 have been problem areas, and unless they fix these holes at the top of the order, there could be more problems down the road, especially with the Ashes coming up later this year.
| Position | Innings | Runs | Average | 100s/ 50s | Ducks |
| Openers | 122 | 4284 | 36.61 | 7/ 26 | 6 |
| No.3 | 60 | 1574 | 27.13 | 1/ 11 | 10 |
| No.4 | 58 | 1785 | 31.31 | 2/ 12 | 3 |
| No.5 | 58 | 3592 | 66.51 | 13/ 9 | 4 |
| No.6 | 58 | 2080 | 40.00 | 8/ 6 | 6 |
| No.7 | 57 | 1649 | 35.84 | 2/ 12 | 3 |
| Overall top 7 | 413 | 14,964 | 38.96 | 33/ 76 | 32 |
S Rajesh is stats editor of ESPNcricinfo. Follow him on Twitter
Read in App
Elevate your reading experience on ESPNcricinfo App.