Australia's incredible winning streak at home
In the last two years, Australia have a 29-2 win-loss record in home ODIs, with their batsmen scoring 17 hundreds in 32 games; overseas, though, their record isn't that hot
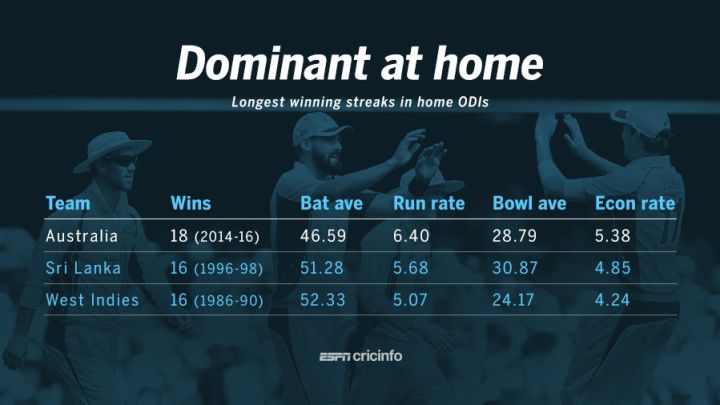
When India were 274 for 1 in the Canberra ODI, needing only 75 more in 13 overs with nine wickets in hand, it seemed certain that Australia's streak of 17 consecutive wins in home ODIs would finally end. As it turned out, nothing of the sort happened: Australia took two wickets in the 38th, which rattled India so much that they could find no way back, handing Australia a 25-run win. Their winning streak at home has extended to 18, which is two more than the previous highest record, by Sri Lanka and West Indies. (The Sri Lankan streak includes the 1996 World Cup, when Australia and West Indies forfeited their matches in Sri Lanka due to safety reasons. Those matches are not included in the streak of 16 wins.)
The details for the three winning streaks are quite similar, though. Australia have the highest run rate and also the highest economy rate, which is in keeping with the manner in which 50-over cricket has changed overs the years. In terms of ratios of run rates to economy rates, there's little to choose among the three teams: Australia's ratio is 1.19, Sri Lanka's 1.17 and West Indies' 1.20. West Indies' team of 1986 to 1990, though, had the better ratio between batting and bowling averages: they scored 52.33 runs per wicket, and conceded 24.17 per dismissal, a ratio of 2.17. Sri Lanka had a ratio of 1.66, with the current Australian team at 1.62. All three teams also won more games chasing than batting first: Australia have won 11 out of 18 games chasing, while West Indies won 11 out of 16 and Sri Lanka ten out of 16.
The last ODI Australia lost at home was in November 2014, against South Africa, but their dominance at home extends even beyond that date. In the last two years, they have played 31 completed ODIs at home, and lost only two. That's an incredible win-loss ratio of 14.5, with the only defeats coming against England and South Africa, both in Perth. Just before the start of that streak, Australia lost two successive home ODIs in the bilateral series against Sri Lanka, but since coming back to win the last game of that series, they've been on a roll.
| Team | Wins | Bat ave | Run rate | Bowl ave | Econ rate |
| Australia | 18 (2014-16) | 46.59 | 6.4 | 28.79 | 5.38 |
| Sri Lanka | 16 (1996-98) | 51.28 | 5.68 | 30.87 | 4.85 |
| West Indies | 16 (1986-90) | 52.33 | 5.07 | 24.17 | 4.24 |
During this period, no team has come close to the sort of record Australia has racked up at home: the next best is New Zealand's 24-9 record, while India are third with a 15-8 win-loss ratio.
| Team | Mat | Won | W/ L ratio | Bat ave | Run rate | Bowl ave | Econ rate |
| Australia | 32 | 29/ 2 | 14.50 | 42.93 | 6.01 | 27.35 | 5.30 |
| New Zealand | 37 | 24/ 9 | 2.67 | 37.83 | 6.06 | 29.35 | 5.32 |
| India | 24 | 15/ 8 | 1.88 | 44.24 | 6.04 | 36.82 | 5.81 |
| South Africa | 21 | 13/ 7 | 1.86 | 40.56 | 5.74 | 25.58 | 5.08 |
| Sri Lanka | 32 | 19/ 11 | 1.73 | 37.23 | 5.75 | 28.62 | 5.45 |
| Bangladesh | 30 | 18/ 11 | 1.64 | 32.63 | 5.40 | 26.06 | 4.89 |
| West Indies | 19 | 11/ 7 | 1.57 | 31.90 | 5.09 | 27.97 | 4.70 |
| England | 31 | 13/ 17 | 0.76 | 29.98 | 5.69 | 34.78 | 5.76 |
| Pakistan | 25 | 9/ 15 | 0.60 | 31.09 | 5.25 | 34.76 | 5.27 |
| Zimbabwe | 39 | 12/ 27 | 0.44 | 25.98 | 4.58 | 37.32 | 5.16 |
While Australia have been unstoppable at home during this period, their overseas ODI record in these two years isn't so hot: in 29 games, they have a 14-12 win-loss record. They have won all three in the UAE, but only have a 5-5 record in India, and 2-3 in India.
Among all teams, India and South Africa have better win-loss ratios in away ODIs than Australia. The batting and bowling stats also show a drop in Australia's run rate in away games (5.73) compared to their rate of 6.01 at home; the average drops too, from 42.93 to 36.33, while the bowling numbers are marginally poorer.
| Team | Mat | Won | W/ L ratio | Bat ave | Run rate | Bowl ave | Econ rate |
| India | 56 | 31/ 21 | 1.48 | 35.93 | 5.40 | 28.94 | 5.18 |
| South Africa | 50 | 28/ 20 | 1.40 | 35.57 | 5.60 | 28.01 | 5.15 |
| Australia | 29 | 14/ 12 | 1.17 | 36.33 | 5.73 | 30.23 | 5.43 |
| Sri Lanka | 53 | 25/ 26 | 0.96 | 30.45 | 5.20 | 35.08 | 5.54 |
| England | 38 | 17/ 20 | 0.85 | 33.40 | 5.34 | 32.01 | 5.34 |
| New Zealand | 31 | 13/ 16 | 0.81 | 35.87 | 5.63 | 32.83 | 5.78 |
| Pakistan | 50 | 24/ 24 | 1.00 | 30.43 | 5.08 | 33.45 | 5.23 |
| Bangladesh | 15 | 5/ 9 | 0.56 | 28.70 | 5.19 | 40.58 | 5.70 |
| West Indies | 33 | 9/ 23 | 0.39 | 27.77 | 5.52 | 39.94 | 6.00 |
| Zimbabwe | 25 | 3/ 21 | 0.14 | 24.94 | 4.91 | 39.50 | 5.57 |
Australia's batsmen have been especially prolific in home conditions, scoring 17 centuries in 32 games. Their current captain Steven Smith has led the way, scoring four of those hundreds, and averaging 74 at a strike rate of very nearly a run a ball. Since scoring 95 in a World Cup game against Afghanistan in March, Smith has topped 40 in each of the nine ODI innings he has played at home. Aaron Finch has five centuries in 30 innings, while David Warner has two. The batsman with the biggest difference in terms of home and away numbers, though, is Smith: his home stats are sensational, but in away ODIs, his average drops to 32, and his strike rate to 75, in the last two years. Smith's overall average in away ODIs is 27 (strike rate 79), while at home he averages 58 at a strike rate of 97; the away numbers are less than overwhelming, and an aspect Smith will want to correct as early as possible. Overall, Australian batsmen have struck nine hundreds in 29 away ODIs, compared to 17 in 32 home games.
| Player | Home-Inns | Ave | SR | 100s | Away-Inns | Ave | SR | 100s |
| Steven Smith | 19 | 74.00 | 98.25 | 4 | 14 | 32.07 | 75.08 | 1 |
| David Warner | 21 | 43.00 | 106.96 | 2 | 8 | 45.00 | 86.53 | 0 |
| George Bailey | 20 | 42.00 | 88.25 | 2 | 27 | 48.54 | 90.45 | 1 |
| James Faulkner | 19 | 41.77 | 111.90 | 0 | 17 | 41.81 | 112.46 | 1 |
| Glenn Maxwell | 26 | 40.80 | 128.29 | 1 | 22 | 33.80 | 129.79 | 0 |
| Aaron Finch | 30 | 40.30 | 88.50 | 5 | 22 | 40.14 | 89.11 | 2 |
| Shane Watson | 18 | 37.81 | 95.12 | 1 | 17 | 36.81 | 105.17 | 2 |
| Mitchell Marsh | 9 | 31.50 | 89.36 | 0 | 14 | 33.16 | 96.60 | 0 |
| Michael Clarke | 13 | 29.84 | 86.41 | 0 | 6 | 71.50 | 86.40 | 1 |
Among the bowlers, pace has obviously been more effective at home than overseas. Mitchell Starc has 44 wickets from 19 home ODIs at an average of 15.31, but overseas he has been less effective, taking 21 wickets from 13 games at 27.76. Similarly, Mitchell Johnson and James Faulkner have better home numbers too. Spinners have taken more wickets overseas, but overall, Australia's batting and bowling has combined far more effectively in home conditions, making them virtually unbeatable there. Overseas, teams have had a lot more success against Australia.
| Player | Home-ODIs | Wkts | Ave | Econ | Away-ODIs | Wkts | Ave | Econ |
| Mitchell Starc | 19 | 44 | 15.31 | 4.39 | 13 | 21 | 27.76 | 5.50 |
| James Faulkner | 27 | 43 | 27.93 | 5.54 | 21 | 22 | 38.59 | 5.69 |
| Mitchell Johnson | 18 | 31 | 23.80 | 4.74 | 20 | 29 | 27.75 | 4.86 |
| Glenn Maxwell | 30 | 24 | 36.83 | 5.25 | 23 | 18 | 31.61 | 5.83 |
| Clint McKay | 9 | 17 | 22.88 | 4.78 | 14 | 17 | 34.00 | 5.14 |
| Nathan Coulter-Nile | 8 | 15 | 24.46 | 5.39 | 5 | 7 | 30.85 | 5.31 |
| Pat Cummins | 6 | 10 | 32.50 | 5.90 | 7 | 16 | 18.31 | 5.31 |
| Mitchell Marsh | 10 | 9 | 34.66 | 5.44 | 15 | 11 | 33.36 | 5.64 |
| Bowler type | Home-Mat | Wkts | Ave | Econ | Away-Mat | Wkts | Ave | Econ |
| Pace | 32 | 223 | 26.86 | 5.21 | 29 | 143 | 32.31 | 5.31 |
| Spin | 32 | 34 | 41.20 | 5.11 | 29 | 50 | 33.28 | 5.30 |
S Rajesh is stats editor of ESPNcricinfo. Follow him on Twitter
Read in App
Elevate your reading experience on ESPNcricinfo App.