Dissecting Suresh Raina's ODI stats
His stats by point of entry show that he struggles when he comes in before the 20th over, but he has been hugely successful in the middle overs
Suresh Raina's international career has been a curious one. He made his debut in July 2005, and a few years later established himself as one of the core members of India's limited-overs side. There were always question-marks about his technique - against fast bowling in general and the short ball in particular - but in shorter formats that wasn't a deficiency that could be exploited fully by fielding teams. His Test match forays haven't been as successful - despite a century on debut - but that wasn't such a surprise. In the last few months, though, his ODI career has stuttered too: he was dropped for the series in Australia, even as he returned to the team for the T20I series and played a key role in the 3-0 victory.
It's clear that Raina remains an asset in T20Is - he became only the second Indian to play 50 matches in that format - but what do his ODI stats say about the kind of batsman he has been? Has he done enough to deserve a longer run, or do India need to look at others for the No. 5/6 slot? Here's what the numbers say about him.
What stands out about Raina's overall numbers in both ODIs and T20Is is his consistency across the years. Since the middle of 2008, when he became a regular member of India's ODI side - he has missed only 27 of India's 214 ODIs since June 2008 - Raina has consistently averaged in the mid-30s, with a strike rate in the mid-90s. He has had his problems in the bouncier conditions of Australia and South Africa, averaging only 25.83 in 25 innings in those two countries, but he has done much better in England and New Zealand, averaging more than 46 at a strike rate of 115 from 19 innings. (Click here for his ODI career summary.)
| Period | Inngs | Runs | Ave | SR | 100s/ 50s |
| Before 2008 | 28 | 612 | 26.60 | 72.68 | 0/ 3 |
| 2008 to 2012 | 104 | 3130 | 38.17 | 97.96 | 3/ 21 |
| 2013 onwards | 60 | 1826 | 35.11 | 96.05 | 2/ 12 |
| Career | 192 | 5568 | 35.46 | 93.76 | 5/ 36 |
The issues about his technique that have been highlighted in the past are reflected again in the tables below, which split up his batting stats at Nos. 5 and 6 by the period of the innings when he has come in to bat. His overall average at No. 5 is 35.32, but when he has come in with India three down for 60 or fewer runs, he has averaged 26 in 19 innings. That improves to almost 33 when he has come in with 61 to 100 runs on the board, but his average and strike rate both improve dramatically when he has come in with more than 100 runs on the board; in 25 such innings, he has topped 50 ten times. When he comes in after 200, the average drops as he obviously needs to take more risks with fewer overs remaining.
The story is similar at No. 6: a sub-30 average with a strike rate in the early 70s when he comes in at 80 or fewer runs at four down, but the numbers get much healthier when he comes in with more runs on the board.
| Entry score | Inngs | Runs | Ave | SR | 50+ scores |
| 60 or less | 19 | 501 | 26.37 | 72.71 | 3 |
| 61 to 100 | 24 | 719 | 32.68 | 85.49 | 5 |
| 101 to 200 | 25 | 1006 | 50.30 | 116.98 | 10 |
| 201 and above | 13 | 176 | 25.14 | 123.94 | 0 |
| Entry score | Inngs | Runs | Ave | SR | 50+ scores |
| 80 or less | 17 | 428 | 28.53 | 71.69 | 2 |
| 81 to 175 | 25 | 809 | 40.45 | 93.85 | 5 |
| 176 and above | 19 | 469 | 36.08 | 125.74 | 3 |
The graphic below combines those two tables, and groups his performances by the stage of the innings when he has come in to bat, at Nos. 5 and 6. In the 36 innings when he has come in to bat within the first 15 overs, Raina has passed 50 just four times, while his average drops to less than 25. When coming in between the 16th and 20th overs, his average goes up, but it's still less than 30. Clearly, he has hasn't relished the opportunity to come in early against a new-ish ball and bail his team out after the loss of early wickets.
Raina's comfort zone is batting against a slightly older ball in the middle overs, and the stats reflect that: when he comes in to bat between the 21st and the 35th overs, his average skyrockets to 53.43, while the strike rate goes up to 105. He has 19 fifty-plus scores in 59 innings during this period, compared to eight in 56 innings when he has come in within the first 20 overs.
And then there's Raina's career numbers in ODIs against pace and spin: though he has a better strike rate against pace, his average against them is almost 18 points lower. Among the four bowlers who have dismissed him most often in ODIs are Mitchell Johnson, Steven Finn, and Jerome Taylor; he averages less than 20 against all of them.
| Bowling type | Dismissals | Average | Strike rate |
| Pace | 107 | 33.29 | 99.17 |
| Spin | 39 | 51.15 | 85.33 |
| Bowler | Runs | Balls | Dismissals | Average | SR |
| Steven Finn | 93 | 101 | 5 | 18.60 | 92.08 |
| Mitchell Johnson | 52 | 51 | 5 | 10.40 | 101.96 |
| Nuwan Kulasekara | 121 | 120 | 5 | 24.20 | 100.83 |
| Jerome Taylor | 41 | 55 | 5 | 8.20 | 74.55 |
| Angelo Mathews | 78 | 96 | 4 | 19.50 | 81.25 |
| Morne Morkel | 41 | 44 | 4 | 10.25 | 93.18 |
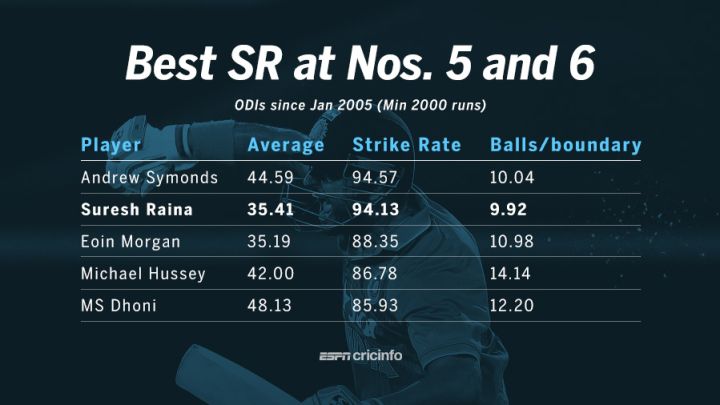
Raina has his problems against pace, and against the new ball, but it's also apparent that his overall stats at Nos. 5 and 6 remain impressive: his strike rate of 94.13 is second only to Andrew Symonds among batsmen who have scored at 2000 runs at those positions since the beginning of 2005. Raina also hits a four or a six every 9.92 balls - among the 14 batsmen in this 2000-plus run list, only Yuvraj Singh has a better rate (9.90). Clearly, when he comes after the 20th over, his ability to score big and score briskly is an asset. Even in a more recent period, he has done well in this aspect: since 2014, he averages 43 at a strike rate of 104 when he comes in between the 20th and the 35th; since 2013, the average is 46 and the average 102. And then there is his ability in the field, and his offspin.
For the selectors and the team management, the debate would be whether his strengths are good enough to gloss over his obvious weakness when he comes in early. The argument in favour of his selection is that a lot of ODI pitches these days are flat tracks, and India's top three have been so good recently that it isn't often that they are three or four down within 20 overs. Manish Pandey's century in the Sydney ODI, though, has given the selectors another option for the middle-order slots. The onus is on Raina to lift his game and prove once again that he deserves that No. 5/6 slot ahead of anyone else.
| Player | Inns | Runs | Ave | SR | balls/bound |
| Andrew Symonds | 73 | 2631 | 44.59 | 94.57 | 10.04 |
| Suresh Raina | 142 | 4108 | 35.41 | 94.13 | 9.92 |
| Eoin Morgan | 103 | 3027 | 35.19 | 88.35 | 10.98 |
| Michael Hussey | 105 | 3486 | 42.00 | 86.78 | 14.14 |
| MS Dhoni | 169 | 5873 | 48.13 | 85.93 | 12.20 |
| Yuvraj Singh | 68 | 2447 | 46.16 | 85.85 | 9.90 |
| Angelo Mathews | 111 | 3327 | 41.58 | 85.61 | 11.99 |
| Umar Akmal | 87 | 2695 | 36.41 | 85.50 | 11.50 |
S Rajesh is stats editor of ESPNcricinfo. Follow him on Twitter
Read in App
Elevate your reading experience on ESPNcricinfo App.