England's problems against spin
Unlike other teams which play spin better, England have lost too many wickets to slow bowlers in the middle overs, suggesting a riskier approach to scoring runs
After being thrashed in the Test series, India have recovered remarkably to win the ODI series with a game to spare, and the performance of their spinners has been a big reason for this resurgence. In three ODIs, the Indian spinners have already taken more wickets than they did in five Tests: their ODI series stats read 17 wickets for 324 runs in 76.1 overs (average 19.05, economy rate 4.25); in the Tests they had figures of 14 for 617 in 219.3 overs (average 44.07). (England's spinners, on the other hand, have gone from 20 for 475 in the Tests to 3 for 169 from 34 overs in the ODIs.)
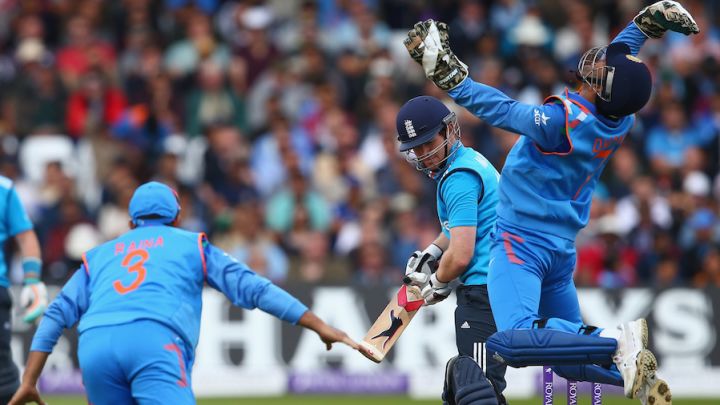
England's limp batting display against Ravindra Jadeja (7 for 106 in 27 overs) and R Ashwin (6 for 125 in 29.1 overs) has once again raised question marks about their ability to play spin in limited-overs cricket. In the Tests, with no urgency to score quickly, England's batsmen have been fine against spin, taking their time to settle in before opting for aggressive strokeplay. It also helped, of course, that India never had runs on the board in the last three Tests to allow their spinners to put pressure on England. However, with the focus being on quick scoring in the ODIs, England have struggled against spin, bringing this aspect of their cricket into focus again.
In ODIs played since the 2011 World Cup, England's batting average against spin is among the lowest, with only Zimbabwe and West Indies having done worse. England's average of 31.42 is significantly worse than those of New Zealand, Pakistan, Australia and India, who average around 40 runs per wicket. England's batsmen are clearly more comfortable when there's more pace on the ball - their average and run rate against the quicker bowlers are much better.
| Spinners | Seamers | ||||||
| Versus | Matches | Wickets | Average | Econ rate | Wickets | Average | Econ rate |
| Zimbabwe | 38 | 114 | 30.53 | 4.60 | 159 | 26.26 | 4.36 |
| West Indies | 69 | 202 | 30.75 | 4.55 | 279 | 30.07 | 5.16 |
| England | 69 | 167 | 31.42 | 4.85 | 256 | 37.40 | 5.36 |
| Bangladesh | 45 | 108 | 32.29 | 4.42 | 210 | 26.89 | 4.99 |
| Sri Lanka | 99 | 230 | 33.60 | 4.64 | 434 | 30.85 | 5.25 |
| South Africa | 54 | 144 | 34.31 | 4.74 | 194 | 38.78 | 5.64 |
| New Zealand | 45 | 85 | 39.32 | 4.95 | 212 | 31.43 | 5.60 |
| Pakistan | 78 | 142 | 39.40 | 4.72 | 378 | 29.35 | 4.77 |
| Australia | 69 | 142 | 40.10 | 4.91 | 309 | 34.13 | 5.49 |
| India | 86 | 137 | 42.60 | 4.96 | 360 | 38.57 | 5.60 |
England's problems against spin tend to get magnified in the middle overs (between the 16th and 40th), when opposition teams tend to use slow bowlers to stifle the scoring rates. Batting teams prefer to use a relatively risk-free approach in these overs, and the template is to accumulate around to four to five runs an over without losing too many wickets during this period. Compared to other teams, England's run rate during this period is reasonably healthy - most of the teams in the table below are bunched at around 4.50 to 5.00 runs per over. However, the numbers below indicate that while other teams are able to do so without taking too many risks, England lose too many wickets in the process, thus also hurting their chances in the slog overs.
England have averaged 27.81 runs per wicket against spin in the middle overs since the last World Cup, which is easily the lowest among the top ten teams, lower even than Bangladesh, Zimbabwe and West Indies, who all average more than 30. England have lost 132 wickets to spin in the middle overs in 64 matches, which is an average of around two per innings; the teams which are on top in the table below lose around one wicket per innings. New Zealand, surprisingly, are on top of the table with a 50-plus average and a run rate of more than five, but that's also because they've played spin particularly well at home, averaging 64.11 at a rate of 5.26 in 18 games. In Sri Lanka and the West Indies, they've averaged 27.65 at a rate of 4.61 in ten games.
Australia and India are the other teams with 45-plus averages, and while their scoring rates aren't too different from England's, both these teams average less than 1.30 wickets per game to spin in the middle overs. England's problem has been their inability to score reasonably quickly while keeping their wickets in tact.
| Team | Inngs | Wkts | Average | Run rate | Dot % |
| New Zealand | 42 | 45 | 51.53 | 5.02 | 47.76 |
| Australia | 64 | 83 | 46.67 | 4.86 | 49.83 |
| India | 83 | 92 | 45.78 | 4.82 | 48.92 |
| Sri Lanka | 95 | 146 | 38.35 | 4.58 | 50.08 |
| Pakistan | 76 | 105 | 38.14 | 4.70 | 50.70 |
| South Africa | 53 | 91 | 37.82 | 4.79 | 47.30 |
| Zimbabwe | 37 | 67 | 34.76 | 4.53 | 54.71 |
| West Indies | 67 | 132 | 31.87 | 4.57 | 58.19 |
| Bangladesh | 42 | 76 | 31.59 | 4.28 | 52.96 |
| England | 64 | 132 | 27.81 | 4.73 | 48.29 |
Eoin Morgan has been a key member of England's limited-overs side, and is likely to be a key player in the middle order for the World Cup as well. His overall numbers since the 2011 World Cup are impressive despite a recent poor run - 1597 runs at 38.95, and a strike rate of 92.79. However, he has been one of England's poorest batsmen against spin over the last 40 months. He has fallen to spinners 21 times in the middle overs, averaging 24.38. Of those 21 dismissals, 17 have been against right-arm spinners, and his average against them is 19.58. Ashwin has dismissed him four times in 43 balls, conceding just 26 runs, while JP Duminy, Saeed Ajmal and Sachithra Senanayake have all dismissed him twice each, in very few deliveries. Against faster bowlers, on the other hand, Morgan has done much better, averaging more than 57 while scoring at a similar as he does against spin.
Most of the other England batsmen don't have such a huge discrepancy in their records against spin and pace, though most of them score at a quicker rate against the faster bowlers.
| v spin | v seam | |||||
| Batsman | Dismissals | Average | Run rate | Dismissals | Average | Run rate |
| Eoin Morgan | 21 | 24.38 | 5.32 | 11 | 57.72 | 5.35 |
| Ravi Bopara | 11 | 30.45 | 4.42 | 14 | 32.85 | 5.24 |
| Alastair Cook | 11 | 41.09 | 5.22 | 10 | 31.90 | 5.40 |
| Ian Bell | 8 | 45.62 | 4.59 | 12 | 30.00 | 5.15 |
| Joe Root | 8 | 40.50 | 4.34 | 8 | 43.50 | 4.91 |
| Ben Stokes | 8 | 10.37 | 3.66 | 2 | 33.50 | 4.51 |
| Jonathan Trott | 7 | 56.00 | 4.48 | 8 | 65.12 | 5.15 |
| Craig Kieswetter | 6 | 24.16 | 4.60 | 1 | 56.00 | 4.36 |
| Kevin Pietersen | 6 | 42.16 | 5.00 | 4 | 31.00 | 6.64 |
| Jos Buttler | 4 | 32.75 | 4.01 | 8 | 29.25 | 7.16 |
| Runs | Balls | Dismissals | Average | Runs/ over | |
| Right-arm spin | 333 | 380 | 17 | 19.58 | 5.25 |
| Left-arm spin | 179 | 197 | 4 | 44.75 | 5.45 |
| Bowler | Runs | Balls | Dismissals | Average | Runs/ over |
| R Ashwin | 26 | 43 | 4 | 6.50 | 3.62 |
| JP Duminy | 7 | 15 | 2 | 3.50 | 3.50 |
| Saeed Ajmal | 12 | 23 | 2 | 6.00 | 3.13 |
| Sachithra Senanayake | 14 | 23 | 2 | 7.00 | 3.65 |
If England's batsmen have struggled, then the opposition spinners have enjoyed bowling at them. In the ongoing series, Jadeja has taken seven wickets at an average of 15.14 and an economy rate of 3.92, while Ashwin has six at 20.83 and an economy rate of 4.28. In the middle overs of these three games, Jadeja has six wickets at 13.83, conceding just 3.95 runs per over, while Ashwin has four wickets at 23.50, going at 3.88 per over. Overall too, in the last ten years, these two bowlers have been the highest wicket-takers among spinners against England. On Friday, they will get one more opportunity to add to that tally.
| Bowler | Matches | Wickets | Average | Econ rate |
| Ravindra Jadeja | 17 | 33 | 18.57 | 4.55 |
| R Ashwin | 19 | 31 | 23.96 | 4.81 |
| Harbhajan Singh | 13 | 24 | 21.33 | 4.26 |
| Daniel Vettori | 17 | 21 | 25.80 | 3.97 |
| Saeed Ajmal | 9 | 19 | 22.73 | 5.20 |
S Rajesh is stats editor of ESPNcricinfo. Follow him on Twitter
Read in App
Elevate your reading experience on ESPNcricinfo App.