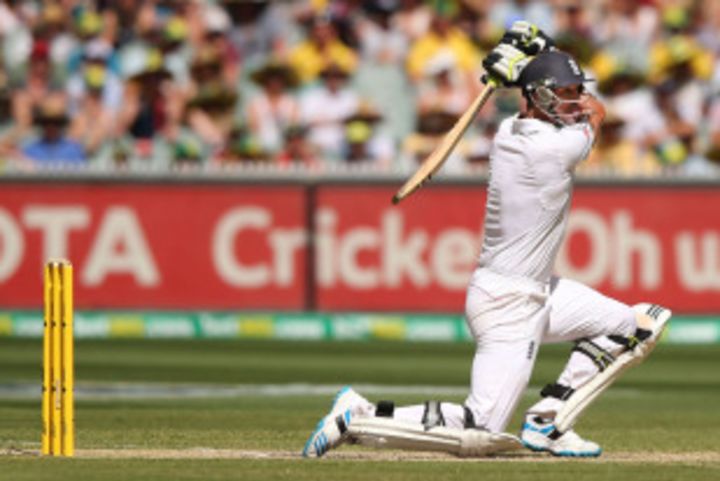
England's batting star across all formats
Kevin Pietersen was a genuine match-winner and often rose to the challenge against quality bowlers
No England batsman has scored more international runs than Kevin Pietersen. In 275 international games, he scored 13,779 runs, 589 more than Graham Gooch, who is next on the list. While Gooch's international career lasted 20 years (including three years in exile), Pietersen's lasted only ten, which shows the kind of impact he had on England cricket while he was around. That he'll no longer be around England cricket is a sad commentary on several non-cricketing aspects, but regardless of the off-field friction he caused, he was an immense force on it, and arguably England's best batsman across all formats over the last three decades.
Through much of his career, Pietersen was England's mainstay in the middle order, the enforcer who could turn a game around through his aggressive batsmanship and forceful personality. His stats, though, don't do him complete justice: he finished with a Test average of 47.28, during an era in which a 50-plus average was no longer as exclusive as in the 1970s, 1980s and 1990s. In the period in which he played Tests, 12 batsmen scored 4000 or more runs at an average higher than his - the 12 were Sangakkara, Chanderpaul, Younis Khan, Kallis, Amla, Clarke, Mahela Jayawardene, Hussey, de Villiers, Laxman, Tendulkar and Ponting. Nine of those batsmen (all the names till de Villiers) averaged more than 50 during this period, and many would argue that Pietersen was good enough to be in that category. (Tendulkar and Ponting obviously had career averages of more than 50, but in the period in question - July 21, 2005 onwards - they averaged 48.63 and 47.61 respectively.)
Pietersen belonged in that club too, till the last couple of years of his international career. At the end of 2011, he'd played 78 Tests and averaged 50.48. (Click here for his cumulative career average in Tests.) He'd scored 19 hundreds till that point, an average of a century every 4.1 Tests, which was an excellent conversion rate. Then came the wretched series against Pakistan in the UAE, where Pietersen scored 67 runs in six innings, at an average of 11.16. That brought his career average hurtling down to 48.69, and though he had some outstanding moments in his last two years as well - including terrific hundreds against South Africa and India - his end-of-Test average never touched 50 again. His last series, against Australia, fetched him only 294 runs in ten innings, bringing his career average down from 48.38, when the series began, to 47.28.
| Period | Tests | Runs | Average | Strike rate | 100s/ 50s |
| Till Aug 2007 | 30 | 2898 | 52.69 | 65.49 | 10/ 10 |
| Sep 2007 to Jan 2010 | 28 | 1926 | 42.80 | 57.75 | 6/ 6 |
| Feb 2010 to Dec 2011 | 20 | 1537 | 59.11 | 64.20 | 3/ 9 |
| Jan 2012 onwards | 26 | 1820 | 38.72 | 58.69 | 4/ 10 |
| Career | 104 | 8181 | 47.28 | 61.72 | 23/ 35 |
In ODIs, Pietersen's natural aggression and his penchant to dominate an attack served him well, especially in the first half of his career. Till the end of 2008, Pietersen averaged 48.36 from 87 ODIs, and could stake his claims to being one of the best in the format. In the period between November 28, 2004 - when Pietersen made his ODI debut - and the end of 2008, the only batsman who scored 2500-plus runs at an average higher than Pietersen's was Shivnarine Chanderpaul, who averaged 52.33; however, Chanderpaul scored at a strike rate of 73.31, compared to Pietersen's 87.58. It could be argued that during that period, there was no better aggressive ODI player than Pietersen.
However, he spoilt his ODI legacy considerably post 2009: in 49 ODIs since then, his average dropped from 48.36 to a mere 30.28, even though the strike rate remained a healthy 84.47. Those numbers spoke of a tendency to play rash strokes, or go on the attack too early in his innings. During that period, even though he still had the ability to dominate and change the course of a game, he was nowhere near the best ODI batsman going around.
| Period | Matches | Runs | Average | Strike rate | 100s/ 50s |
| Till 2008 | 87 | 3047 | 48.36 | 87.58 | 7/ 20 |
| 2009 onwards | 49 | 1393 | 30.28 | 84.47 | 2/ 5 |
| Career | 136 | 4440 | 40.73 | 86.58 | 9/ 25 |
| Batsman | Inngs | Runs | Average | Strike rate | 100s/ 50s |
| Shivnarine Chanderpaul | 75 | 3088 | 52.33 | 73.31 | 6/ 22 |
| Kevin Pietersen | 78 | 3047 | 48.36 | 87.58 | 7/ 20 |
| Matthew Hayden | 58 | 2540 | 47.03 | 82.06 | 6/ 12 |
| MS Dhoni | 112 | 3935 | 46.84 | 90.89 | 4/ 25 |
| Ricky Ponting | 90 | 3752 | 46.32 | 86.47 | 11/ 23 |
| Mohammad Yousuf | 83 | 3146 | 45.59 | 77.31 | 5/ 24 |
| Yuvraj Singh | 109 | 3962 | 44.02 | 89.92 | 8/ 21 |
| Jacques Kallis | 75 | 2604 | 43.40 | 72.77 | 3/ 20 |
England's best since 1980
Before 1970 England had several batsmen who averaged more than 50 - Herbert Sutcliffe, Ken Barrington, Wally Hammond, Jack Hobbs, Len Hutton and Denis Compton were all in that category - but since then there haven't been too many in that category. In the period since 1980, no England batsman has scored 1000 or more runs at a 50-plus average; the best in that category is Pietersen's average of 47.28. The top four in the list below are either in England's current team, or were there till very recently. Alastair Cook, Ian Bell and Jonathan Trott are all closely bunched together, and Cook and Bell have a chance to go past Pietersen if they have a strong home season. Some of the other greats of England's batting line-up feature further down the list, but none of them could match Pietersen's average.
| Batsman | Tests | Runs | Average | 100s/ 50s |
| Kevin Pietersen | 104 | 8181 | 47.28 | 23/ 35 |
| Alastair Cook | 102 | 8047 | 46.51 | 25/ 35 |
| Jonathan Trott | 49 | 3763 | 46.45 | 9/ 18 |
| Ian Bell | 98 | 6722 | 45.41 | 20/ 39 |
| Graham Thorpe | 100 | 6744 | 44.66 | 16/ 39 |
| Graham Gooch | 101 | 8146 | 44.27 | 20/ 40 |
| Marcus Trescothick | 76 | 5825 | 43.79 | 14/ 29 |
| Robin Smith | 62 | 4236 | 43.67 | 9/ 28 |
| David Gower | 100 | 7044 | 43.48 | 15/ 34 |
| Michael Vaughan | 82 | 5719 | 41.44 | 18/ 18 |
England's best at No. 4
Pietersen is also by far England's highest run-getter at No. 4, scoring 6490 runs at that position at an average of 48.43. Among England batsmen, he is more than 2000 runs clear of the second-best, Denis Compton's 4234 runs. No other England batsman has scored 3500 runs at No. 4.
When compared to all No. 4 batsmen around the world, Pietersen's aggregate puts him in seventh place, and among an elite group of batsmen who've scored 6000-plus runs at that slot in Tests. Only four batsmen - Sachin Tendulkar, Jacques Kallis, Mahela Jayawardene and Brian Lara - have scored more centuries at No. 4 than Pietersen's 19.
| Batsman | Innings | Runs | Average | 100s/ 50s |
| Sachin Tendulkar | 275 | 13,492 | 54.40 | 44/ 58 |
| Jacques Kallis | 170 | 9033 | 61.86 | 35/ 36 |
| Mahela Jayawardene | 183 | 9029 | 53.11 | 29/ 31 |
| Brian Lara | 148 | 7535 | 51.25 | 24/ 31 |
| Javed Miandad | 140 | 6925 | 54.10 | 19/ 31 |
| Mark Waugh | 170 | 6662 | 42.43 | 16/ 39 |
| Kevin Pietersen | 139 | 6490 | 48.43 | 19/ 27 |
| Gundappa Viswanath | 124 | 5081 | 43.05 | 12/ 31 |
Pietersen the match-winner
More than all the runs he scored, Pietersen's value to the team was in the number of matches he won for England. He won ten Man-of-the-Match awards in Tests, ten in ODIs, and six in Twenty20 internationals. That makes it a total of 26 such awards for Pietersen in his international career. Since the time of his international debut, only four players - Sangakkara, Shahid Afridi, Shane Watson and Jayawardene have won more Man-of-the-Match awards.
| Player | Matches | MoM awards |
| Kumar Sangakkara | 366 | 30 |
| Shahid Afridi | 265 | 28 |
| Shane Watson | 237 | 28 |
| Mahela Jayawardene | 359 | 27 |
| Kevin Pietersen | 277 | 26 |
| Tillakaratne Dilshan | 343 | 26 |
| Yuvraj Singh | 253 | 25 |
| AB de Villiers | 299 | 23 |
Versus the top bowlers
Perhaps the stats that best illustrate Pietersen's ability to rise to a challenge are his head-to-head stats in Tests against Shane Warne and Dale Steyn, two of the best bowlers who were around during his time in international cricket. Against Warne, Pietersen averaged 61.60, scoring 308 runs off 522 balls, a scoring rate of 3.54 per over. Against Steyn, Pietersen was even more aggressive, scoring at 4.97 per over and averaging 51.66. He wasn't as successful against Glenn McGrath and Muttiah Muralitharan, but even against Murali he looked to dominate, scoring at more than four per over. That, in a nutshell, encapsulated the sort of batsman he was.
| Bowler | Runs | Balls | Dismissals | Average | Run rate |
| Shane Warne | 308 | 522 | 5 | 61.60 | 3.54 |
| Dale Steyn | 155 | 187 | 3 | 51.67 | 4.97 |
| Muttiah Muralitharan | 168 | 236 | 6 | 28.00 | 4.27 |
| Glenn McGrath | 135 | 270 | 5 | 27.00 | 3.00 |
S Rajesh is stats editor of ESPNcricinfo. Follow him on Twitter
Read in App
Elevate your reading experience on ESPNcricinfo App.