Left-arm spin's resurgence, and series runs in vain
After a disappointing phase, left-arm spin has returned to Test cricket with a vengeance
Not so long ago, there was a time when the value of left-arm spin was being seriously questioned, especially in Test cricket. Unlike the offspinners and wrist-spinners, they had no mystery deliveries up their sleeve; it seemed as if they had been left behind as the game moved on and exponents of other trades within it had evolved and found new techniques to keep up. Left-arm spin had been largely reduced to a defensive bowling option, which captains often employed to keep the runs in check.
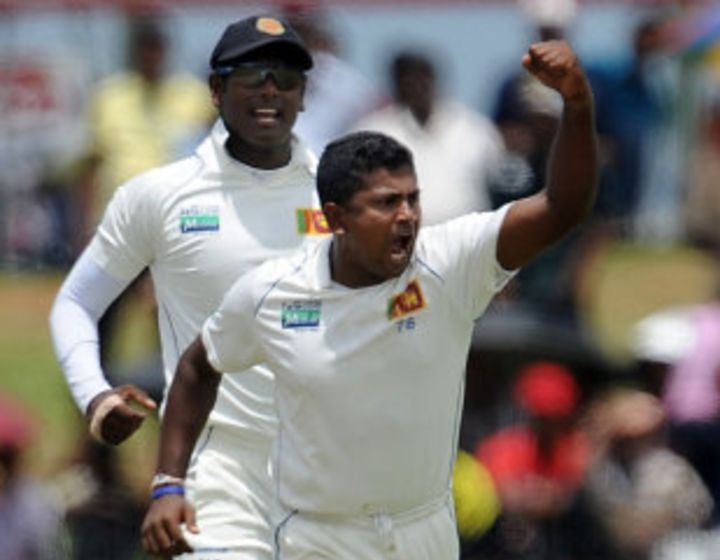
Over the last couple of years, and especially in 2012, all that has changed dramatically. Where there used to be only Daniel Vettori, manfully bowling over after maiden over but seldom picking up a bagful of wickets, there's now Rangana Herath, Abdur Rehman, Pragyan Ojha and, most recently, Monty Panesar, who has returned to Test cricket after a two-and-a-half year hiatus as a hungrier and more skilful bowler. Far from being merely containing options, these bowlers have been integral to the wicket-taking plans of captains, apart from also doing the run-choking act superbly.
The current year has been especially kind to them. Going into the Kolkata Test, left-arm spinners have captured 172 wickets at an outstanding average of 27.01 and a strike-rate of a wicket every ten overs. They've also taken as many ten-wicket hauls in a Test this year as they had from 2005 to 2011 all put together. They've even made a mark at a venue as unfriendly to spin as Perth, with South Africa's Robin Peterson becoming only the fourth left-arm spinner, and the sixth spinner of any kind, to take six or more wickets in a Test at the WACA.
In what's been a remarkable year for them so far, left-arm spinners have taken almost 15% of the total wickets that all bowlers have taken this year, which is a higher percentage than has been achieved in the last 25 years: the last time left-arm spinners grabbed a higher percentage of the total wickets taken by bowlers was in 1987, when Maninder Singh, Iqbal Qasim and Ravi Shastri led them to a tally of 100 wickets out of a total of 657, a percentage of 15.22. Even in that year, though, left-arm spinners averaged 31.87, which is comfortably higher than the 2012 average so far. The last time left-arm spin collectively averaged less than 27 in a year was in 1977 - during the heyday of Bishan Singh Bedi and Derek Underwood - when they averaged 25.35. (Click here for the year-wise stats of left-arm spin.)
| Year | Wickets | Average | Strike rate | 5WI/ 10WM | Total wkts | Average | Left-arm % wkts |
| 2012 | 172 | 27.01 | 60.6 | 16/ 3 | 1155 | 33.79 | 14.89 |
| 2011 | 167 | 29.42 | 71.0 | 9/ 0 | 1233 | 32.31 | 13.54 |
| 2010 | 159 | 43.07 | 89.0 | 5/ 0 | 1252 | 36.60 | 12.70 |
| 2009 | 172 | 37.81 | 76.4 | 8/ 0 | 1214 | 37.70 | 14.17 |
| 2008 | 197 | 37.50 | 79.7 | 12/ 0 | 1445 | 33.68 | 13.63 |
| 2007 | 102 | 37.50 | 74.5 | 4/ 1 | 920 | 34.83 | 11.09 |
| 2006 | 112 | 43.75 | 87.9 | 5/ 1 | 1400 | 34.53 | 8.00 |
| 2005 | 106 | 44.94 | 88.0 | 6/ 1 | 1508 | 33.40 | 7.03 |
| 2004 | 210 | 36.07 | 74.6 | 10/ 1 | 1555 | 35.31 | 13.50 |
| 2003 | 167 | 36.20 | 75.0 | 11/ 2 | 1305 | 36.12 | 12.80 |
| 2002 | 105 | 42.06 | 85.5 | 2/ 0 | 1607 | 32.58 | 6.53 |
A comparison of the success rates of all bowling types in 2012 indicates how good the left-arm spinners have been. While all other bowler types have averaged more than 34 in Tests this years, left-arm spinners have averaged 27. They've also been the most difficult to score runs off, achieving an economy rate of 2.67 runs per over. That means they've offered the captains excellent control, and also been genuine wicket-taking weapons.
| Bowler type | Wickets | Average | Strike rate | Econ rate | 5WI/ 10WM |
| Left-arm spin | 172 | 27.01 | 60.6 | 2.67 | 16/ 3 |
| Right-arm pace | 606 | 34.45 | 65.9 | 3.13 | 23/ 3 |
| Left-arm pace | 78 | 35.15 | 64.1 | 3.28 | 3/ 0 |
| Right-arm spin | 299 | 35.85 | 70.5 | 3.04 | 12/ 4 |
The stats were similar in 2011 as well, though the gap in averages wasn't as large between the left-arm spinners and the next-best: left-arm spinners averaged 29.42, right-arm fast bowlers averaged 30.23, and the other two bowler types both averaged a little more than 37.
However, in the six years before 2011, the stats for left-arm spinners were very different. Between 2005 and 2010, they conceded more than 40 runs per wicket, and took a wicket once every 82 balls. Compared to those numbers, they've improved about 30% in 2012.
During that six-year period, the highest wicket-taker among left-arm spinners was Vettori - his 151 wickets came at 32.62. His wicket-taking ability has declined since - he has taken 21 wickets in nine Tests at 41.57 since the beginning of 2011 - but during that period he was clearly the top left-arm spinner. However, there were also others, like Nicky Boje, Ashley Giles, Mohammad Rafique, Sulieman Benn and Ojha, who had poor averages and strike rates.
| Bowler type | Wickets | Average | Strike rate | Econ rate | 5WI/ 10WM |
| Left-arm pace | 892 | 32.25 | 58.4 | 3.31 | 36/ 5 |
| Right-arm pace | 4212 | 34.23 | 61.6 | 3.33 | 140/ 14 |
| Right-arm spin | 1758 | 35.58 | 68.5 | 3.11 | 83/ 18 |
| Left-arm spin | 848 | 40.36 | 82.3 | 2.94 | 40/ 3 |
In the last couple of years, though, the wickets have come in thick and fast for them. In his first 11 Tests, which he played before 2011, Ojha had conceded 40.40 runs per wicket; since the beginning of 2011, his average has dropped to 21.57 (47 wickets in seven Tests). Panesar has returned stongly for England, Herath has emerged from the considerable shadow of Muttiah Muralitharan, while Abdur Rehman has quietly and consistently been among the wickets even as most of the headlines have been grabbed by Saeed Ajmal.
| Bowler | Tests | Wickets | Average | Strike rate | 5WI/ 10WM |
| Rangana Herath | 18 | 96 | 24.41 | 57.5 | 9/ 2 |
| Abdur Rehman | 13 | 61 | 24.78 | 61.7 | 2/ 0 |
| Pragyan Ojha | 7 | 47 | 21.57 | 50.6 | 5/ 0 |
| Monty Panesar | 4 | 27 | 22.70 | 57.1 | 4/ 1 |
| Shakib Al Hasan | 7 | 27 | 33.77 | 69.6 | 2/ 0 |
Runs in vain
Australia's 1-0 series defeat to South Africa produced one of those rare instances of a team losing a series despite finishing up with a better batting average than the winning team. In Australia's case, that happened because the dominated the first two Tests without winning either: in Brisbane and Adelaide, Australia scored a combined total of 1382 runs for 23 wickets (average 60.08) compared to South Africa's 1252 runs for 32 wickets (average 39.12). In Perth, though, South Africa completely turned the tables, and Australia were powerless to resist. The result of this topsy-turvy series was that South Africa won the series - and retained the top ranking in the process - despite a batting average that was 4.07 runs lower than Australia's.
In the last 110 years, this is the eighth-highest difference in averages between the losing team and the winning team (losing team averaging more than the winning one). The one with the highest difference also featured Australia at the wrong end: in the 2009 Ashes, England finished with a 2-1 series verdict despite averaging only 34.15 runs per wicket, to Australia's 40.64. Australia scored eight hundreds in the series to England's two, and yet lost the crucial moments.
England also managed something similar in the home series against South Africa in 1998, when they won 2-1 despite averaging 6.03 runs fewer per wicket than the visitors. England themselves were at the receiving end in the West Indies in 2008-09, when they lost the first Test and then couldn't even the score, despite being a wicket away from victory in the third match.
India feature a few times too in the table below, twice losing series despite averaging more than the opposition. One of them was in Australia in 1977-78 when they lost 3-2, and the other against Pakistan at home when the visitors won the last Test - a low-scoring thriller in Bangalore - after the first four games were drawn. When India won their first series in England, though, they did so despite finishing with a lower batting average than the hosts.
| Series | Losing team - average | Winning team - average | Difference | Series result |
| Ashes 2009 | Australia - 40.65 | England - 34.15 | 6.49 | 2-1 |
| South Africa in England, 1998 | South Africa - 35.37 | England - 29.34 | 6.03 | 2-1 |
| England in West Indies, 2008-09 | England - 49.56 | West Indies - 43.82 | 5.74 | 1-0 |
| India in Australia, 1977-78 | India - 33.54 | Australia - 28.17 | 5.37 | 3-2 |
| England in Sri Lanka, 2000-01 | Sri Lanka - 29.76 | England - 24.77 | 4.98 | 1-0 |
| Pakistan in India, 1986-87 | India - 38.10 | Pakistan - 33.52 | 4.58 | 1-0 |
| India in England, 1971 | England - 29.85 | India - 25.38 | 4.47 | 1-0 |
| South Africa in Australia, 2012-13 | Australia - 43.42 | South Africa - 39.35 | 4.07 | 1-0 |
S Rajesh is stats editor of ESPNcricinfo. Follow him on Twitter
Read in App
Elevate your reading experience on ESPNcricinfo App.